Most ClickHouse monitoring is reactive. Something goes wrong, an alert fires and an engineer starts digging through system tables. Our proactive support service takes a different approach. Our monitoring platform continuously analyses your cluster, combines hundreds of signals with AI driven analysis, and turns them into a prioritised list of improvements covering cost, performance, reliability, data quality and security.
Tooling alone is only half the picture, so we pair the platform with expert advice. Our ClickHouse consultants review what it surfaces, explain what matters for your workload, advise on the right fixes and work with your team to put them in place. It also gives us a fast and consistent way to assess a new cluster, identify the highest value improvements, and then track that those improvements stick over time.
All of this is backed by a support escalation path under SLA. Your environments are continuously monitored, and when an issue needs attention our ClickHouse experts are on hand to respond to incidents, outages and urgent performance issues.
Key Features
Our platform connects to your ClickHouse cluster and brings everything you need to run it well into a single platform, from cost control and performance monitoring through to data quality, observability and security, with an AI layer that ties the signals together and recommends what to do about them.
[01]
Proactive recommendations
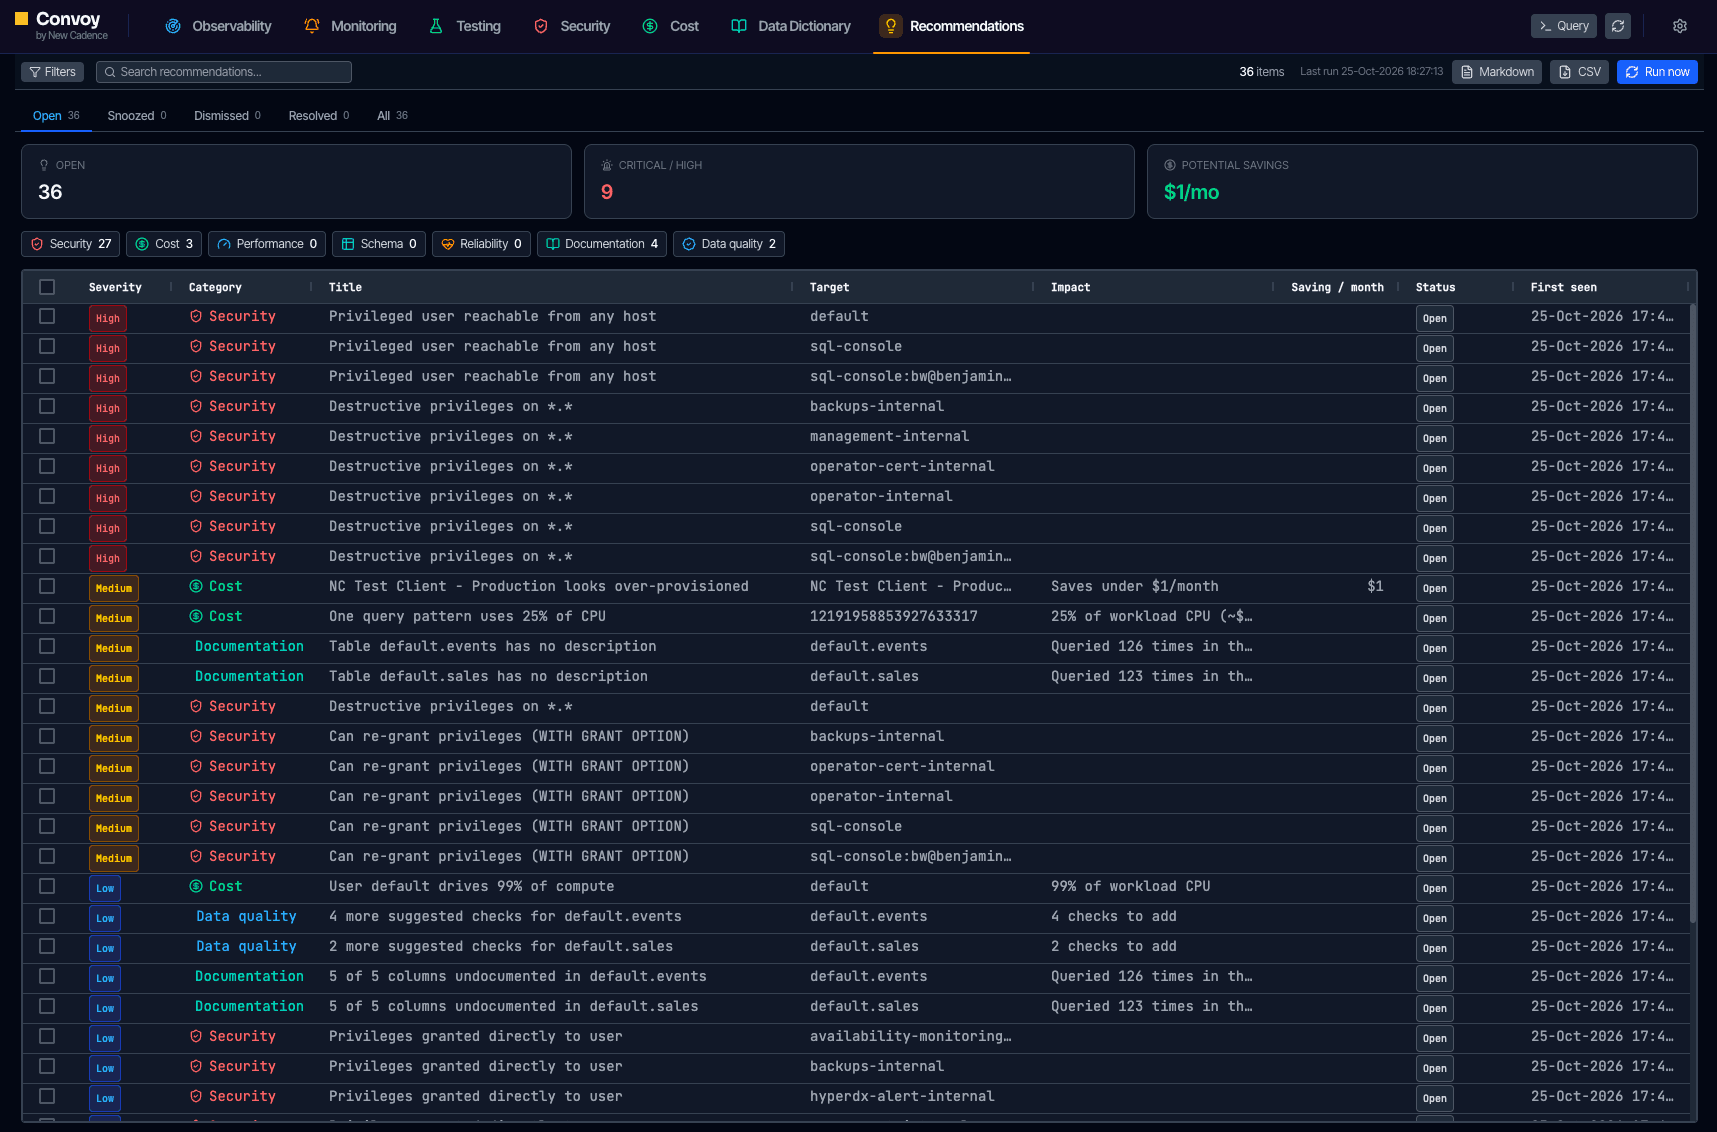
An AI agent continuously reviews your cluster and produces a prioritised list of recommendations across security, cost, performance, schema, reliability and data quality, each with its target, impact and estimated monthly saving.
[02]
Cost control
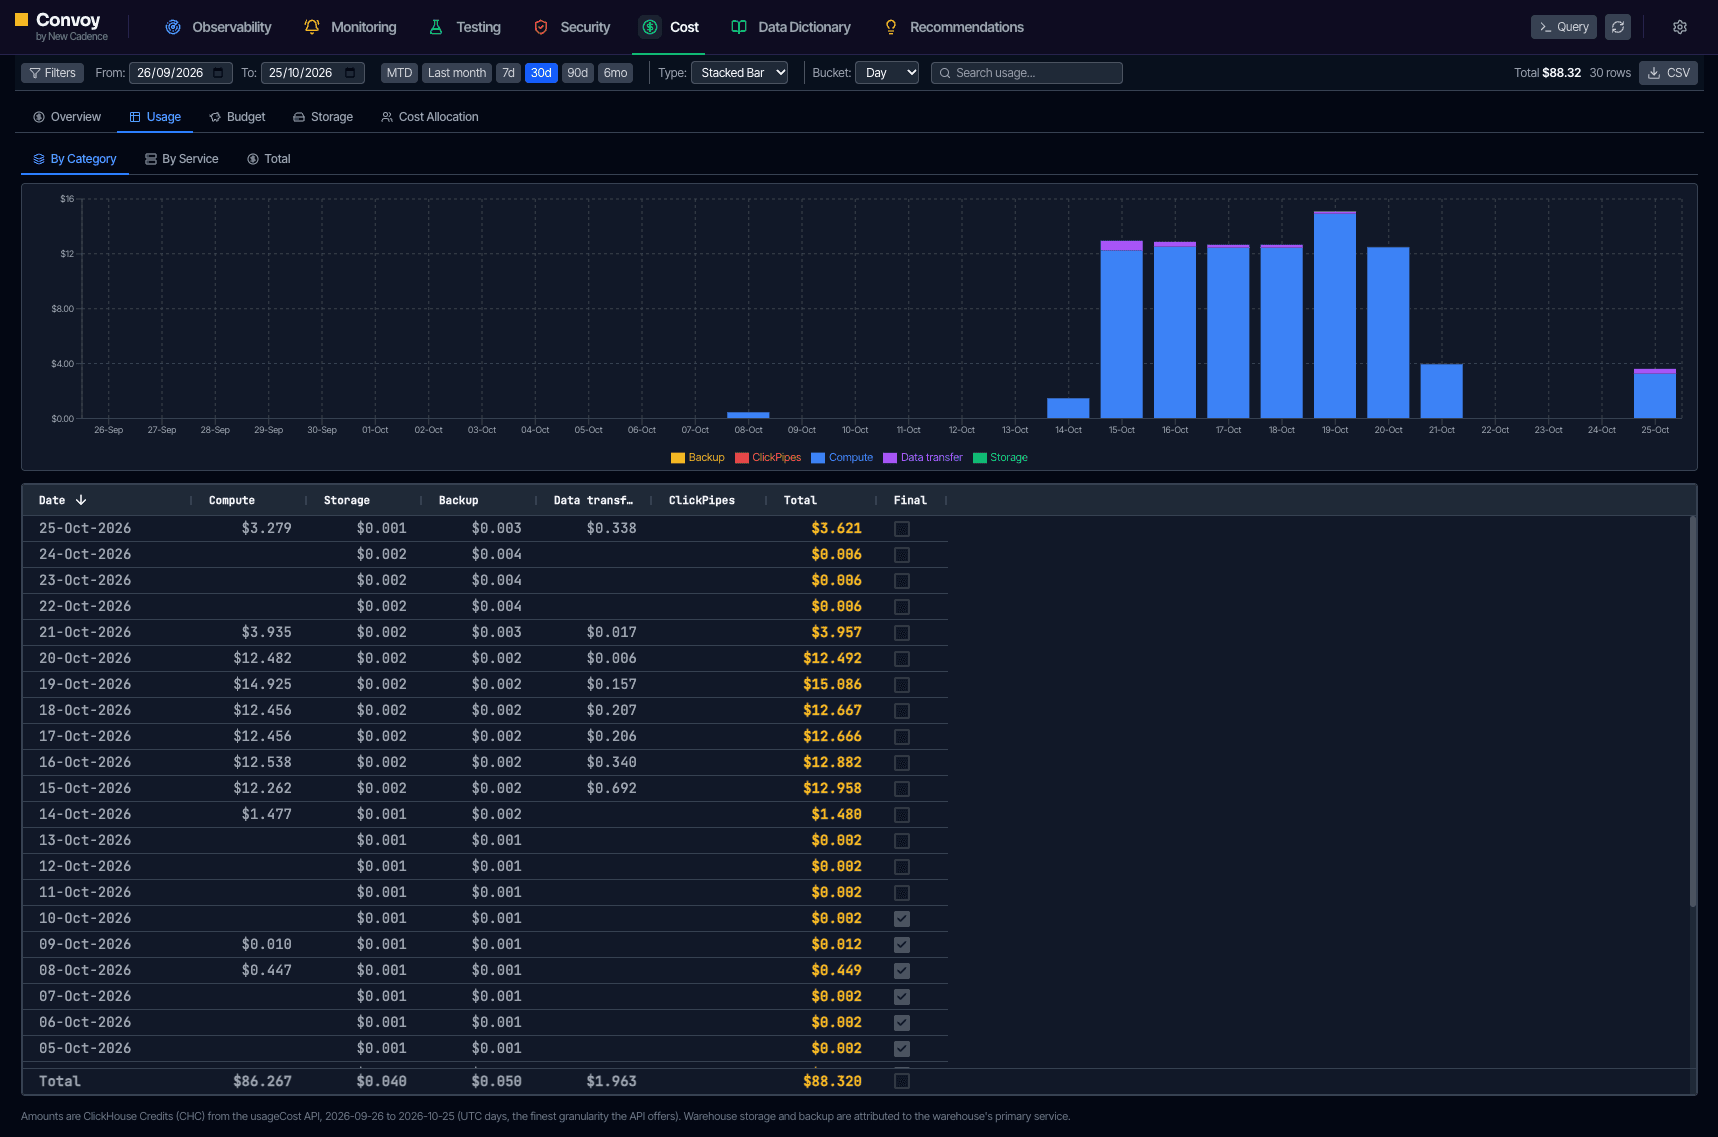
Track spend to date, month end forecasts and remaining credits. Break costs down by category, service and user, set budgets, and identify over-provisioned services and the query patterns driving your compute bill.
[03]
Performance monitoring
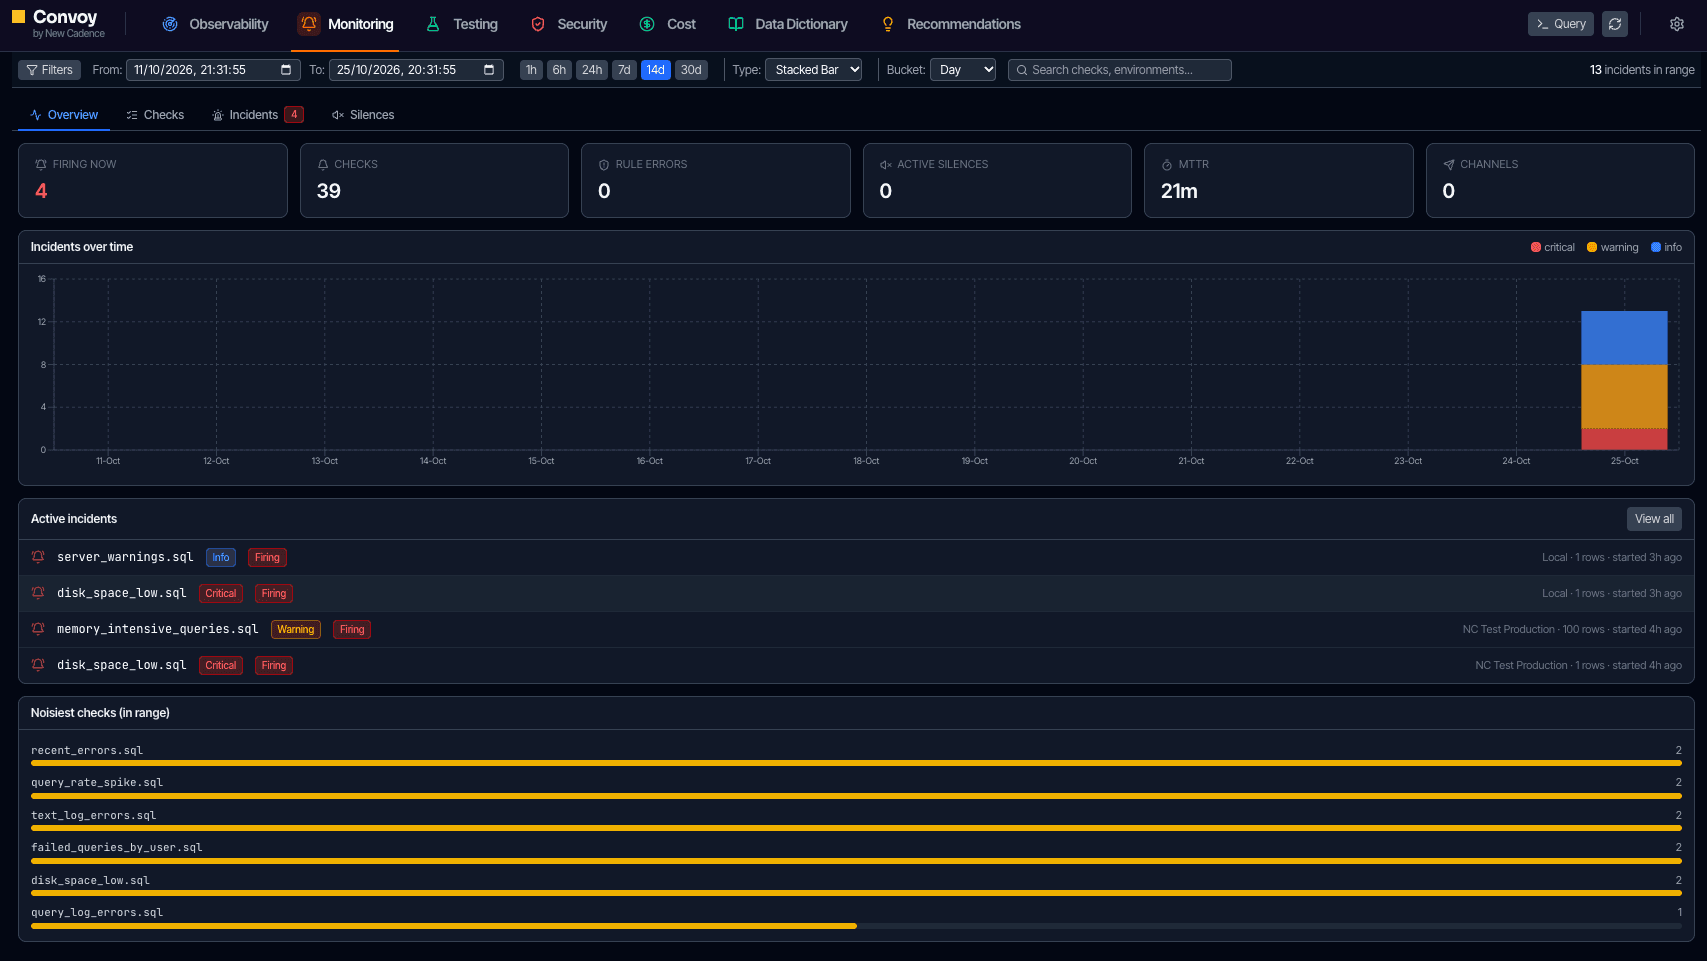
Dozens of built in checks for slow and long running queries, memory pressure, merge backlogs, replication lag, part counts and insert throttling, with history, severity levels, incidents and silences.
[04]
Data quality monitoring
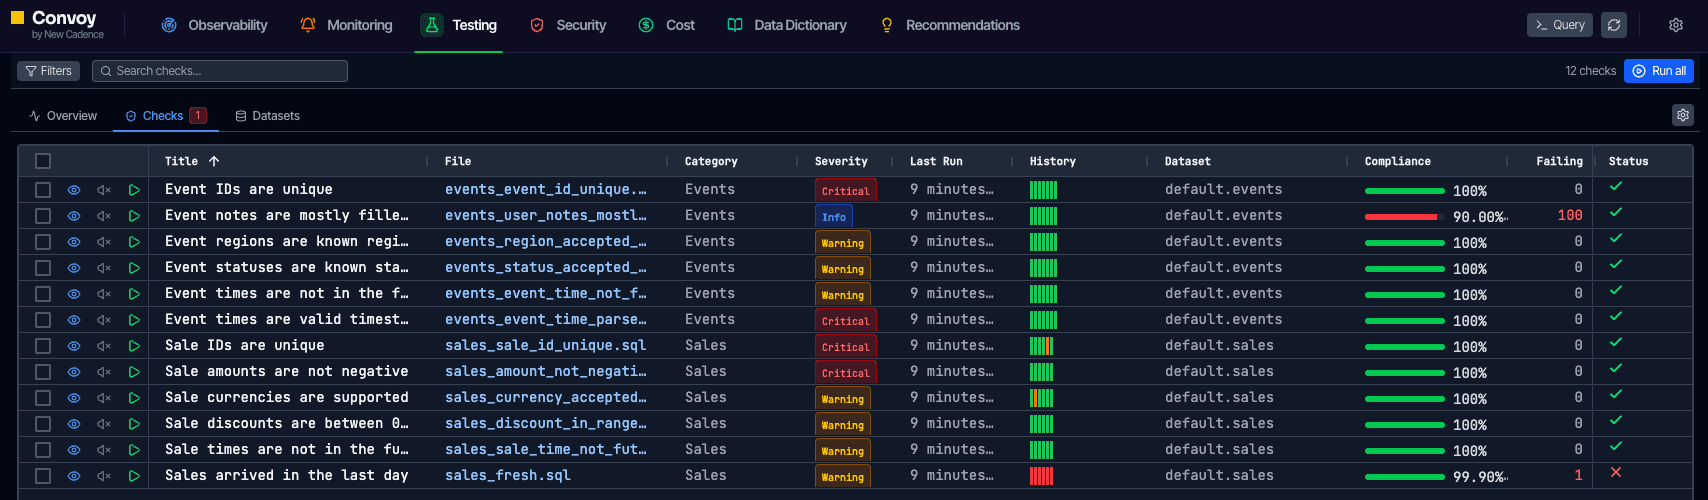
Define tests against your tables for freshness, volume, nulls, duplicates and business rules. We suggest new checks based on how your data is actually used and alerts when something breaks.
[05]
Observability
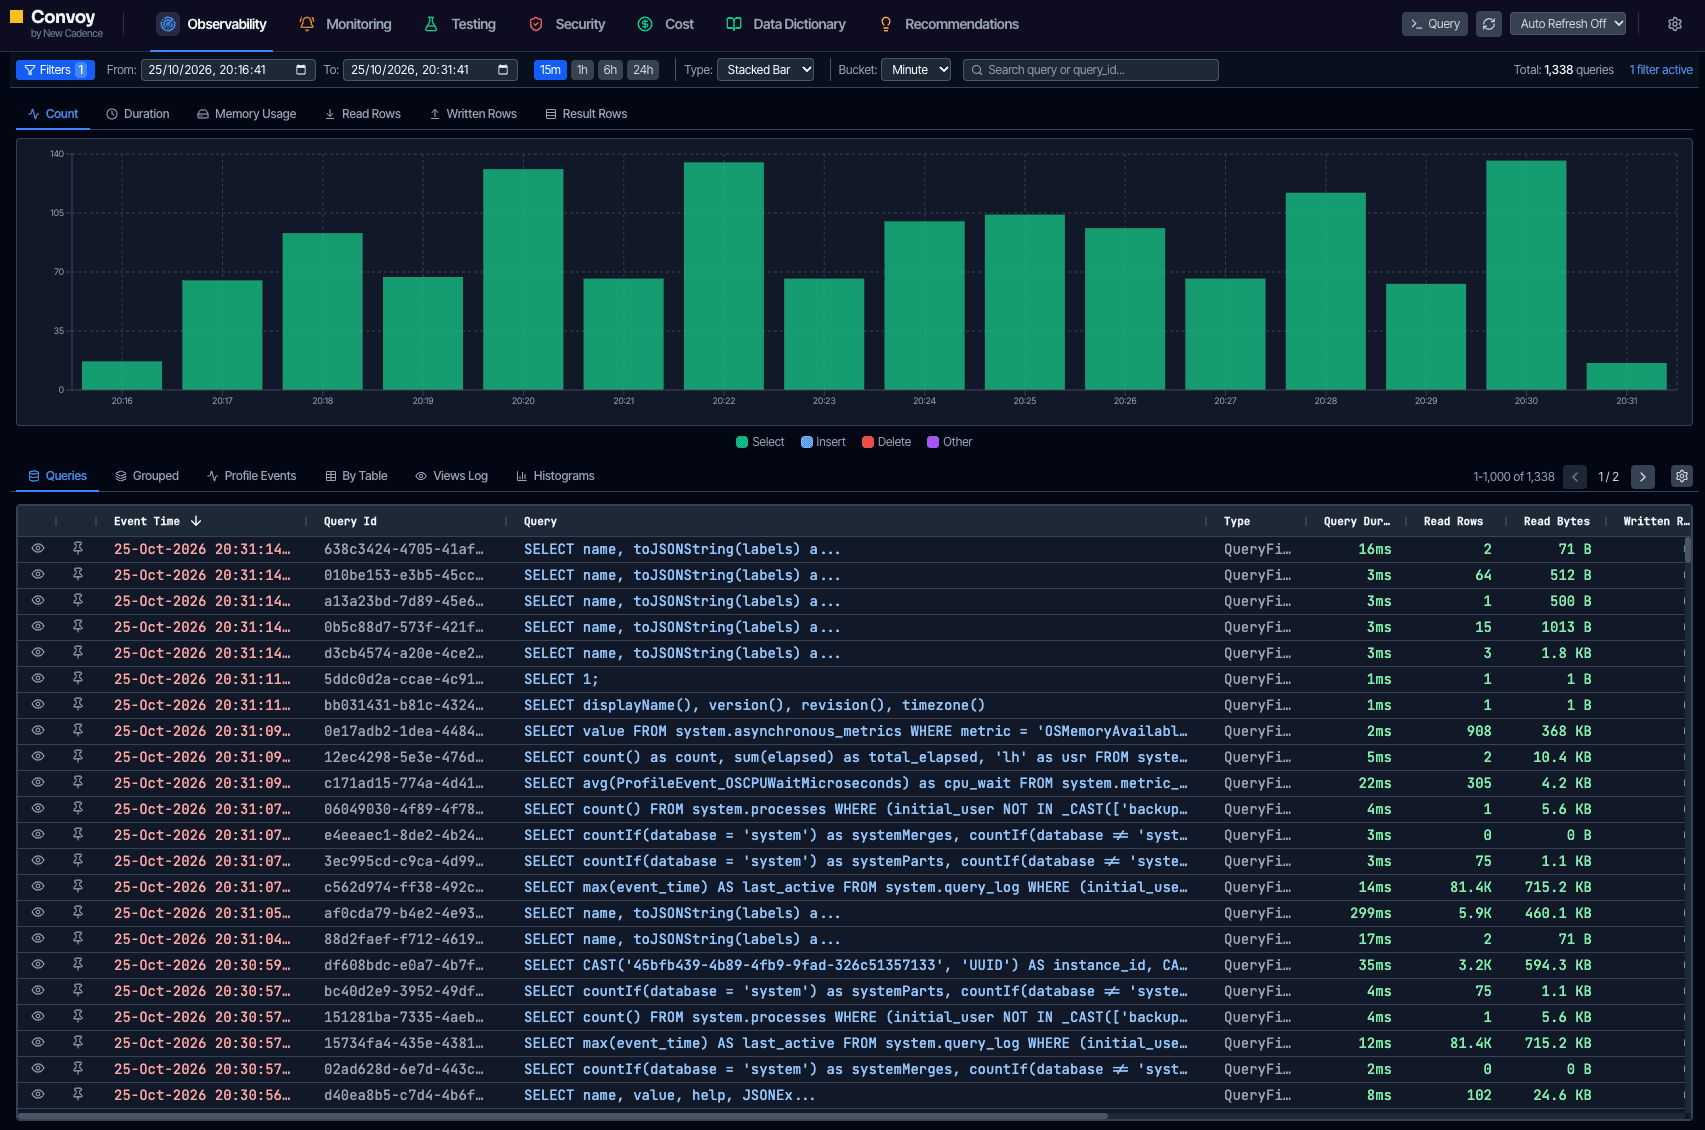
A single view across the query log, part log, metrics and server logs, so you can move from a spike or an alert to the underlying query, merge, user or table in a couple of clicks.
[06]
Security and RBAC monitoring
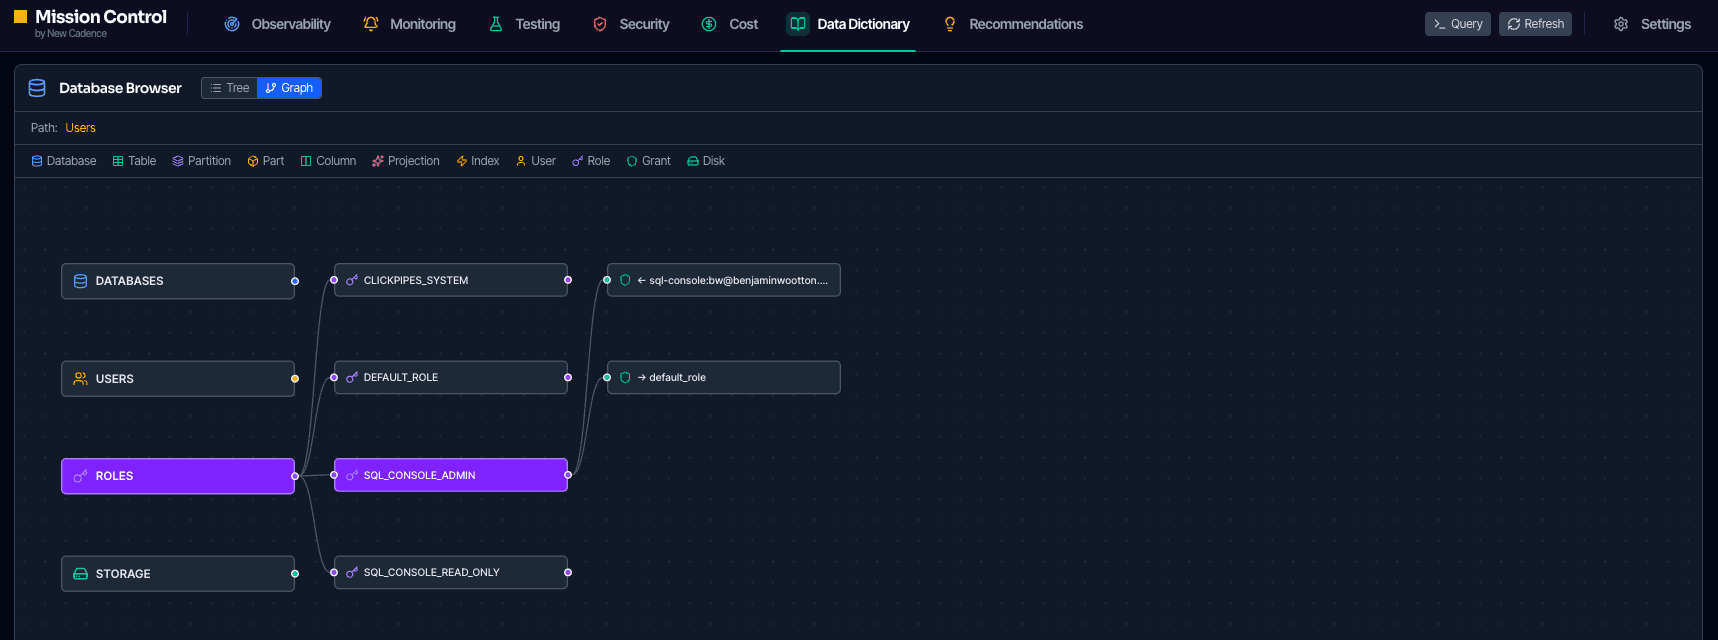
Visualise users, roles and grants as a graph and audit them for risky configurations such as privileged users reachable from any host, destructive privileges on all databases and re-grantable permissions.
[07]
Data dictionary
Catalogue every database, table and column, find undocumented objects that are heavily queried, and keep descriptions up to date so that both people and AI agents understand your data.
[08]
Testing
Run SQL based tests as part of your deployment process or on a schedule, catching regressions in schemas, query performance and data before they reach production users.
Let's Build Something, Fast
Whether you're evaluating ClickHouse, planning a migration, or optimising an existing deployment get in touch now for an initial discussion.
Get in Touch