
Demos
Live ClickHouse Demos
Real-time applications and dashboards built on ClickHouse, each running against a continuous stream of live data. Browse them by what they do or by industry, then open one and explore.
Real-time applications and dashboards built on ClickHouse, each running against a continuous stream of live data. Browse them by what they do or by industry, then open one and explore.
 01
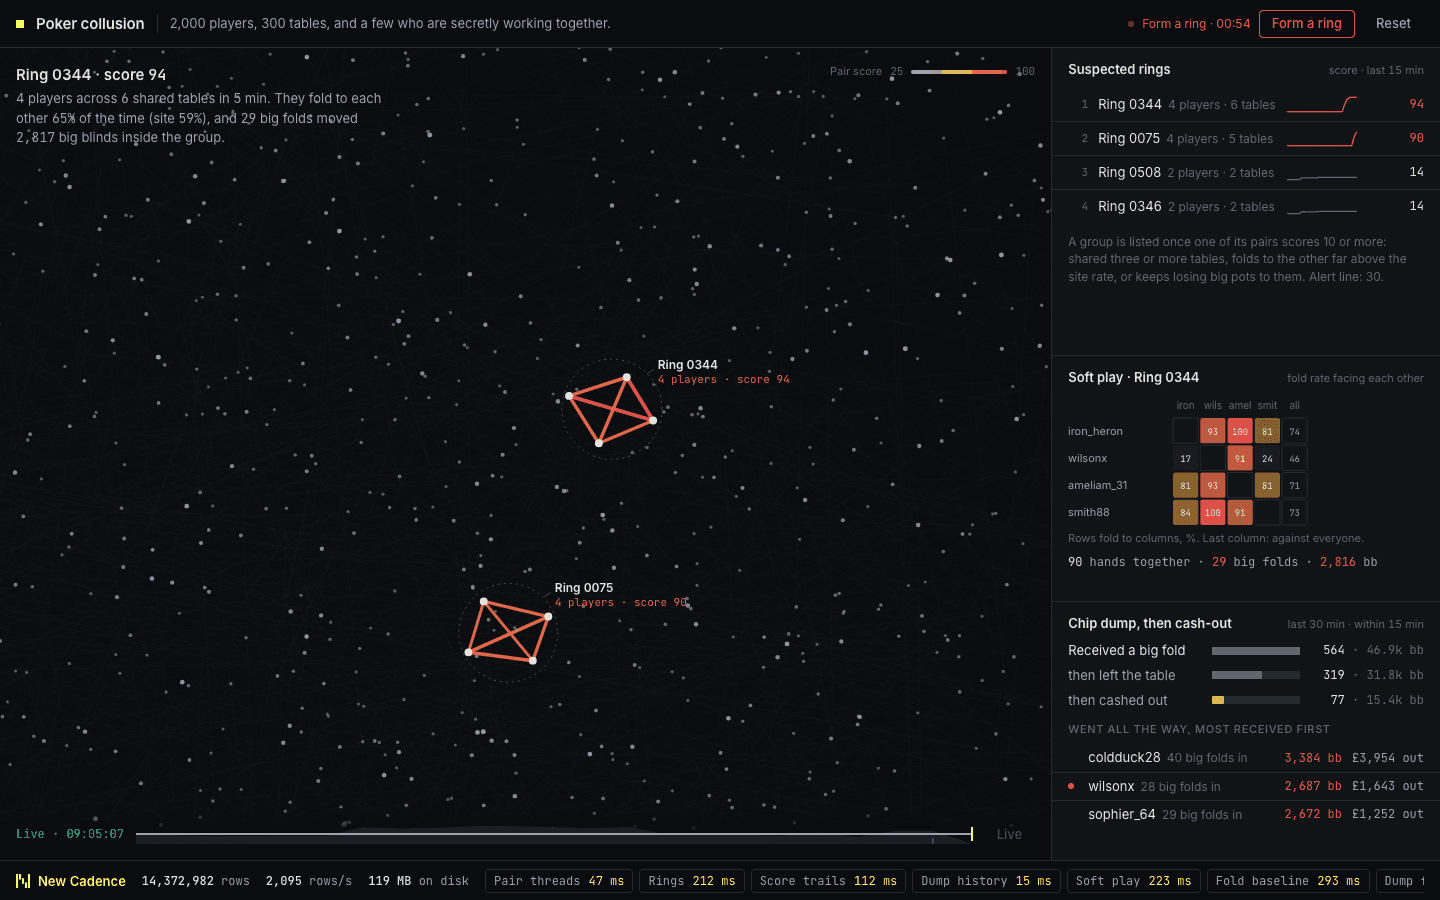
Two thousand online poker players across 300 tables, drawn as a night sky where every pair who share a table are linked by a faint thread. Form a ring and a small group of colluding players starts to glow amber then red as their score climbs, with their chip dumping and cash-outs laid out alongside. Underneath, ClickHouse keeps a running record of who sits with whom in a materialized view and scores each pair over rolling windows. It then checks whether a chip dump is followed by a cash-out within minutes.
 03
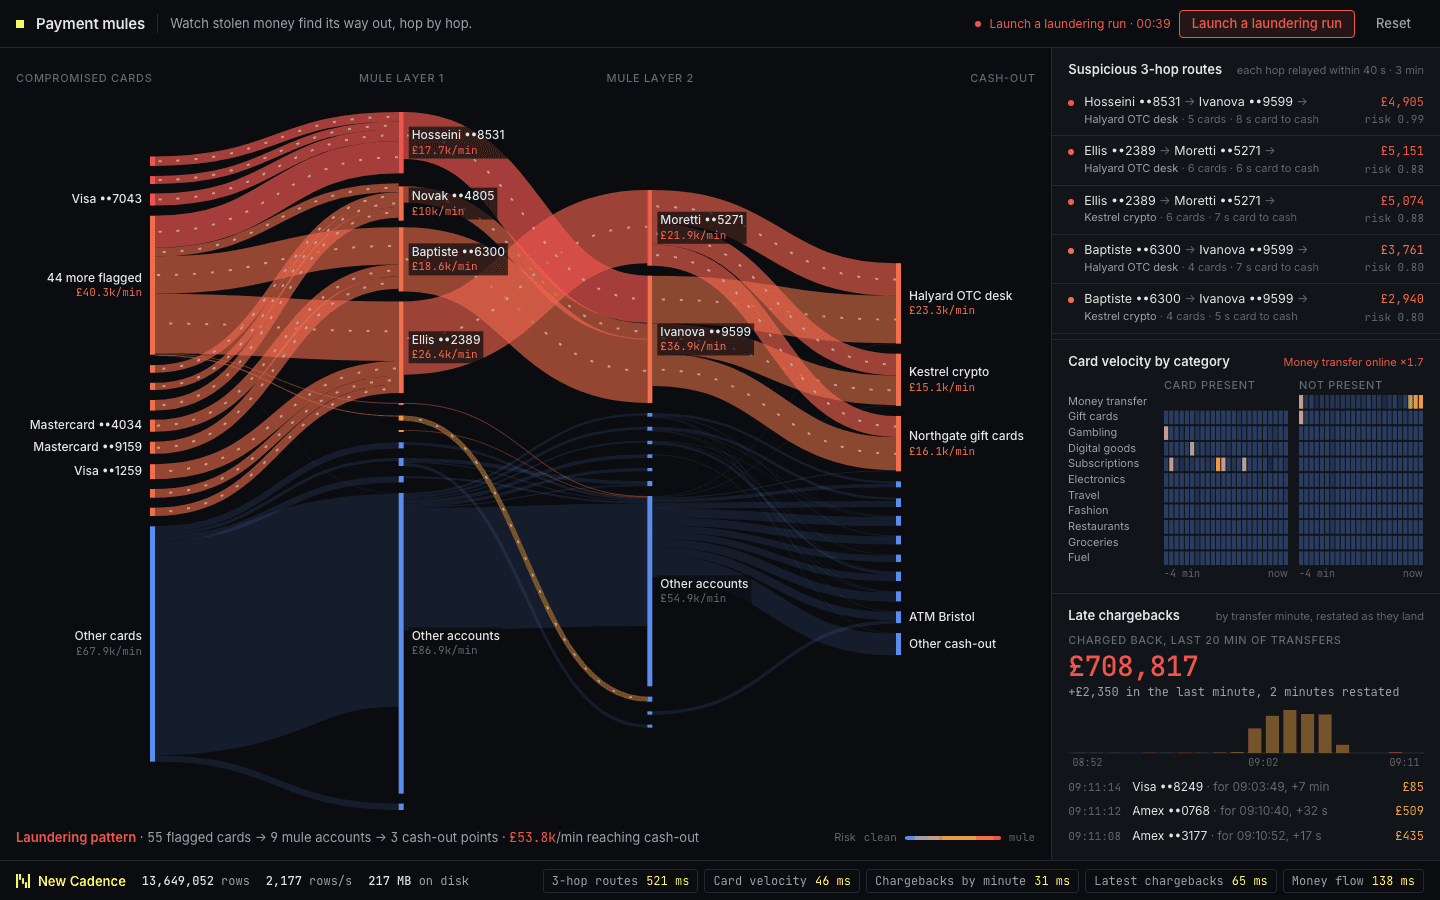
Money flows left to right from compromised cards through two layers of mule accounts to the point where it is cashed out. Launch a laundering run and the suspicious paths thicken and warm in colour, and freezing an account reroutes the flow within seconds. ClickHouse traces two and three hop paths between accounts, keeps the latest state of each account, and absorbs late chargebacks that restate earlier totals.
 07
A schematic UK cell network with call volumes, handoff links and a recurring SIM-box pattern. Inspect a tower and customer segment to find one static device using thousands of subscriber identities for almost exclusively outbound calls. ClickHouse counts distinct subscribers per device, unnests handoff paths and re-queries each network slice.
 11
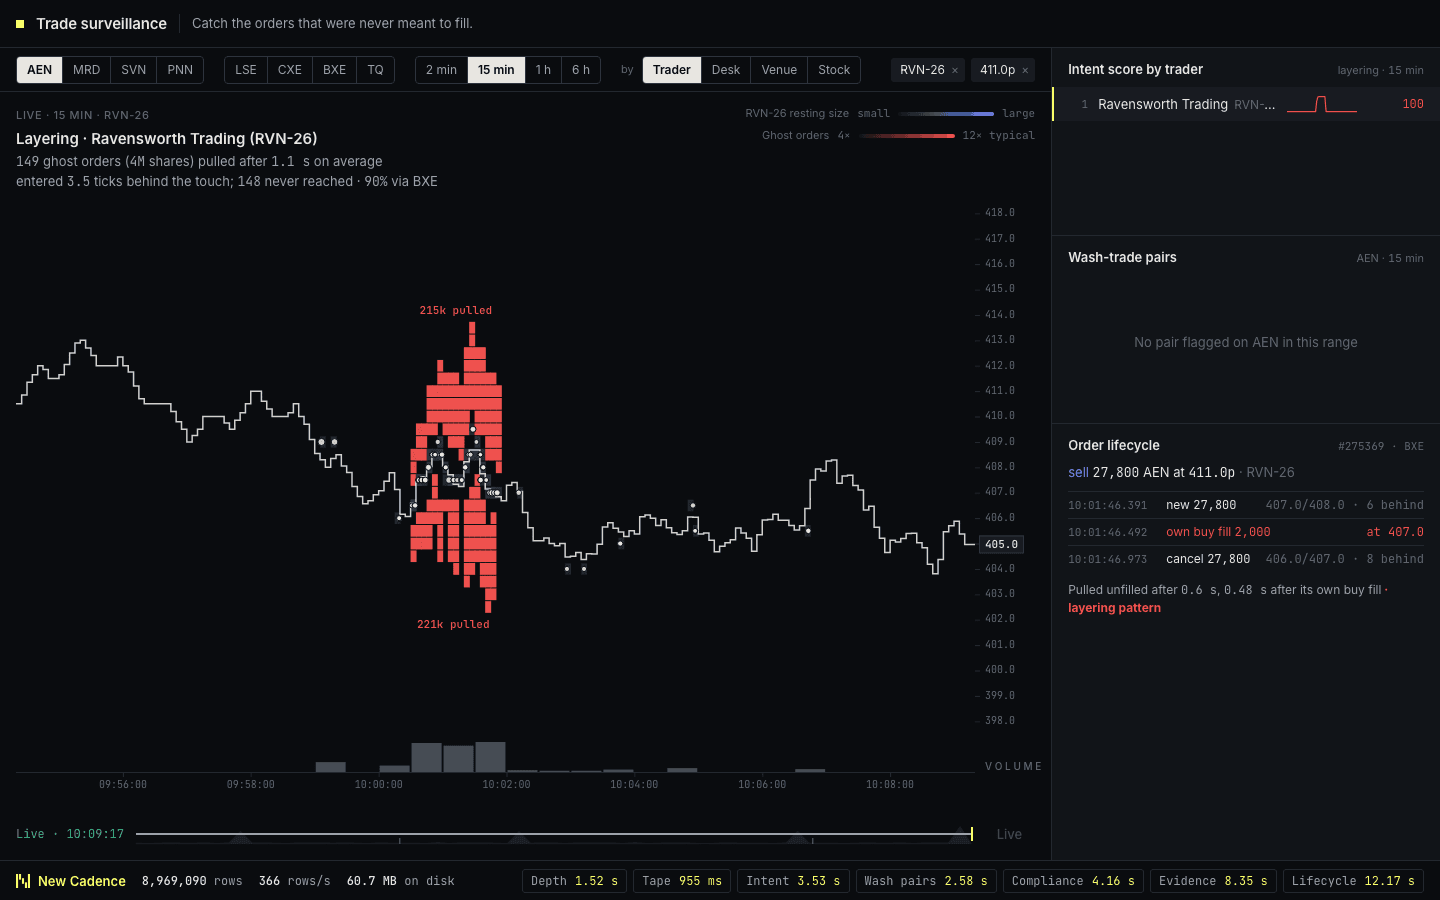
A price chart for each stock with the order book laid over it, showing where genuine liquidity rests and where large orders appear and vanish before they can trade. Layering shows up as shelves of ghost orders stacked beside the price and then pulled. Filter by instrument, venue or time range, regroup by trader or desk, then drill from a stock to a trader to the life of a single order. ClickHouse matches every order event to the best bid and offer in force at that instant and scores each trader for orders cancelled straight after their own fills.
 12
A seeded battle arena with 160 player identities, an engagement map and a skyline of reaction-time medians. Recurring aimbot and teaming scenarios surface automatically in the evidence panels. ClickHouse calculates reaction-time percentiles, headshot ratios and repeated zero-damage encounters from the same combat telemetry used by live operations.
 19
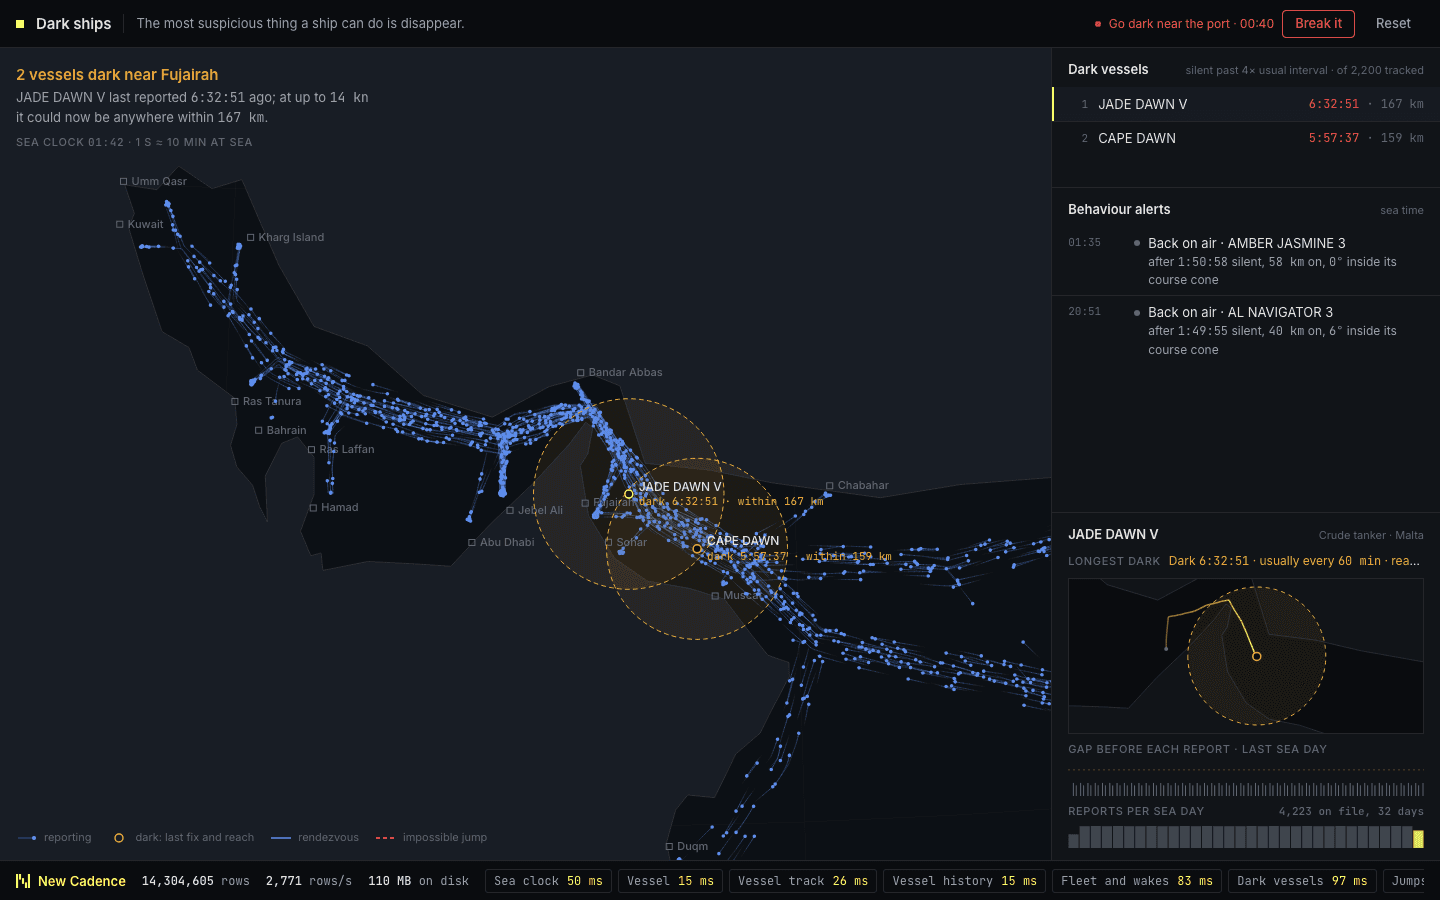
A night-time globe of vessels at sea, each trailing its recent track. When a ship turns off its transponder, its last position is held and a circle grows to show where it could now be, and two ships meeting at sea are linked. Spoof a position and an impossible leg appears, labelled with the speed it would have needed. ClickHouse works out implied speeds from consecutive positions and finds rendezvous by bucketing positions into H3 cells and minutes.
 43
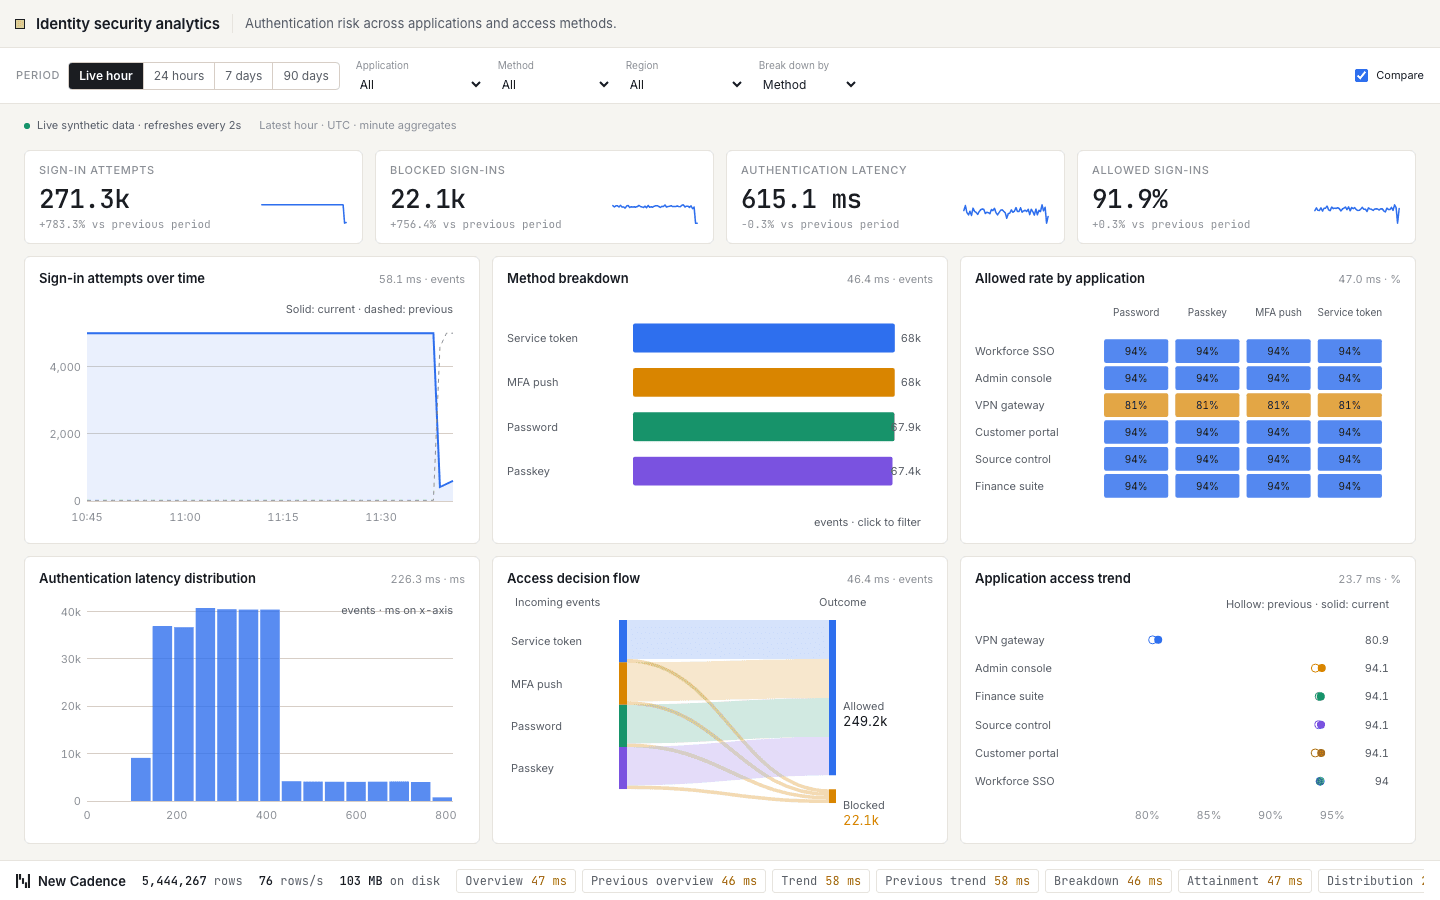
Authentication risk across applications and access methods. Headline figures for sign-in attempts, blocked sign-ins, authentication latency and allowed sign-ins sit above six charts, including sign-in attempts over time, sign-ins by method and allowed rate by application. Filter by application or method, change the period, compare with the previous one, and every chart re-queries. ClickHouse answers each cut from minute-level rollups as new events stream in.
 44
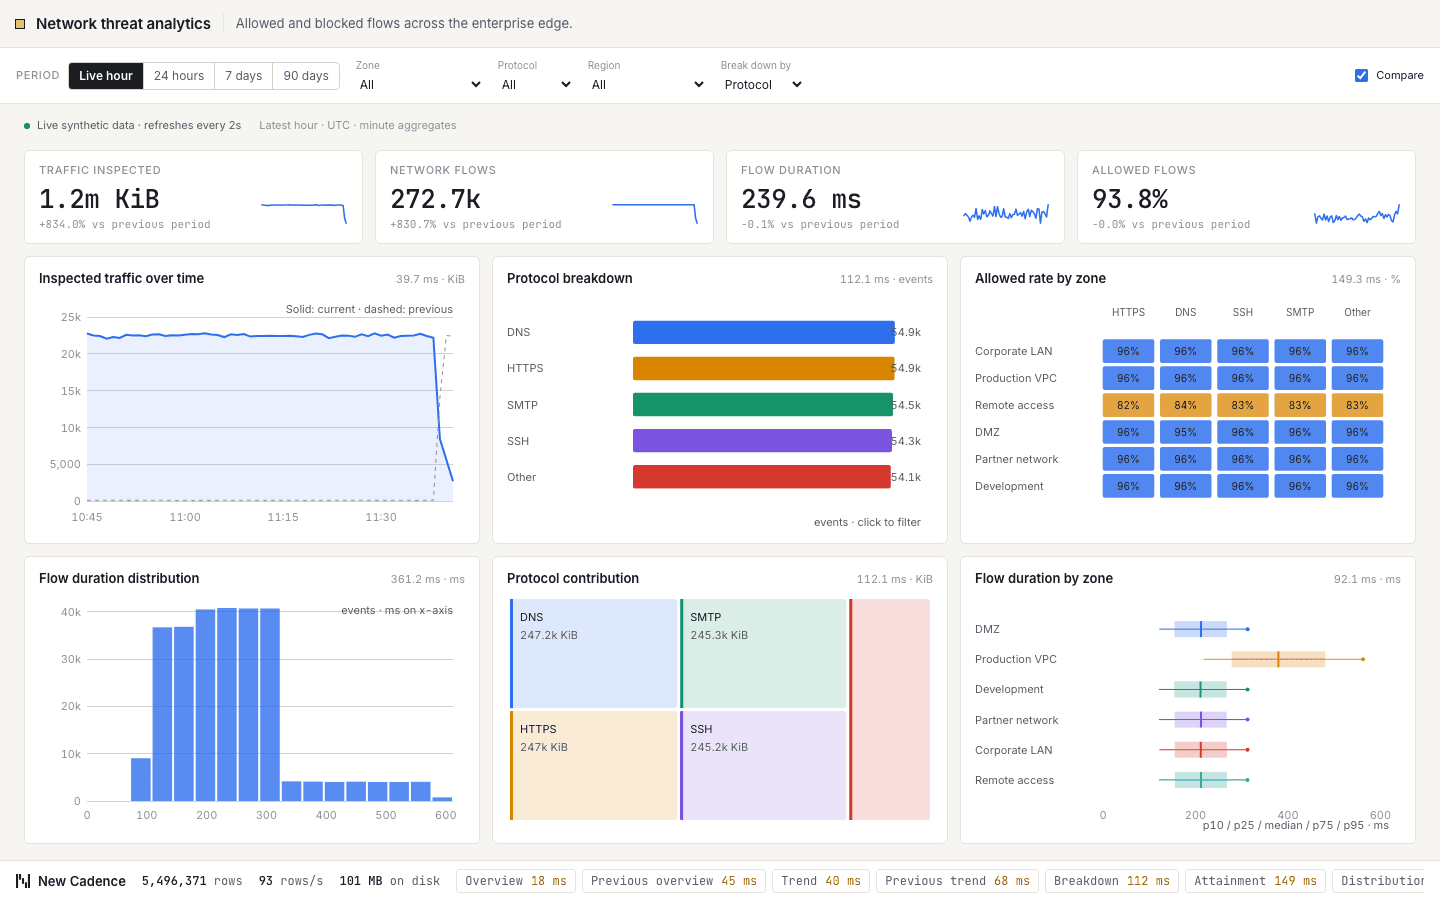
Allowed and blocked flows across the enterprise edge. Headline figures for traffic inspected, network flows, flow duration and allowed flows sit above six charts, including inspected traffic over time, flows by protocol and allowed rate by zone. Filter by zone or protocol, change the period, compare with the previous one, and every chart re-queries. ClickHouse answers each cut from minute-level rollups as new events stream in.
 45
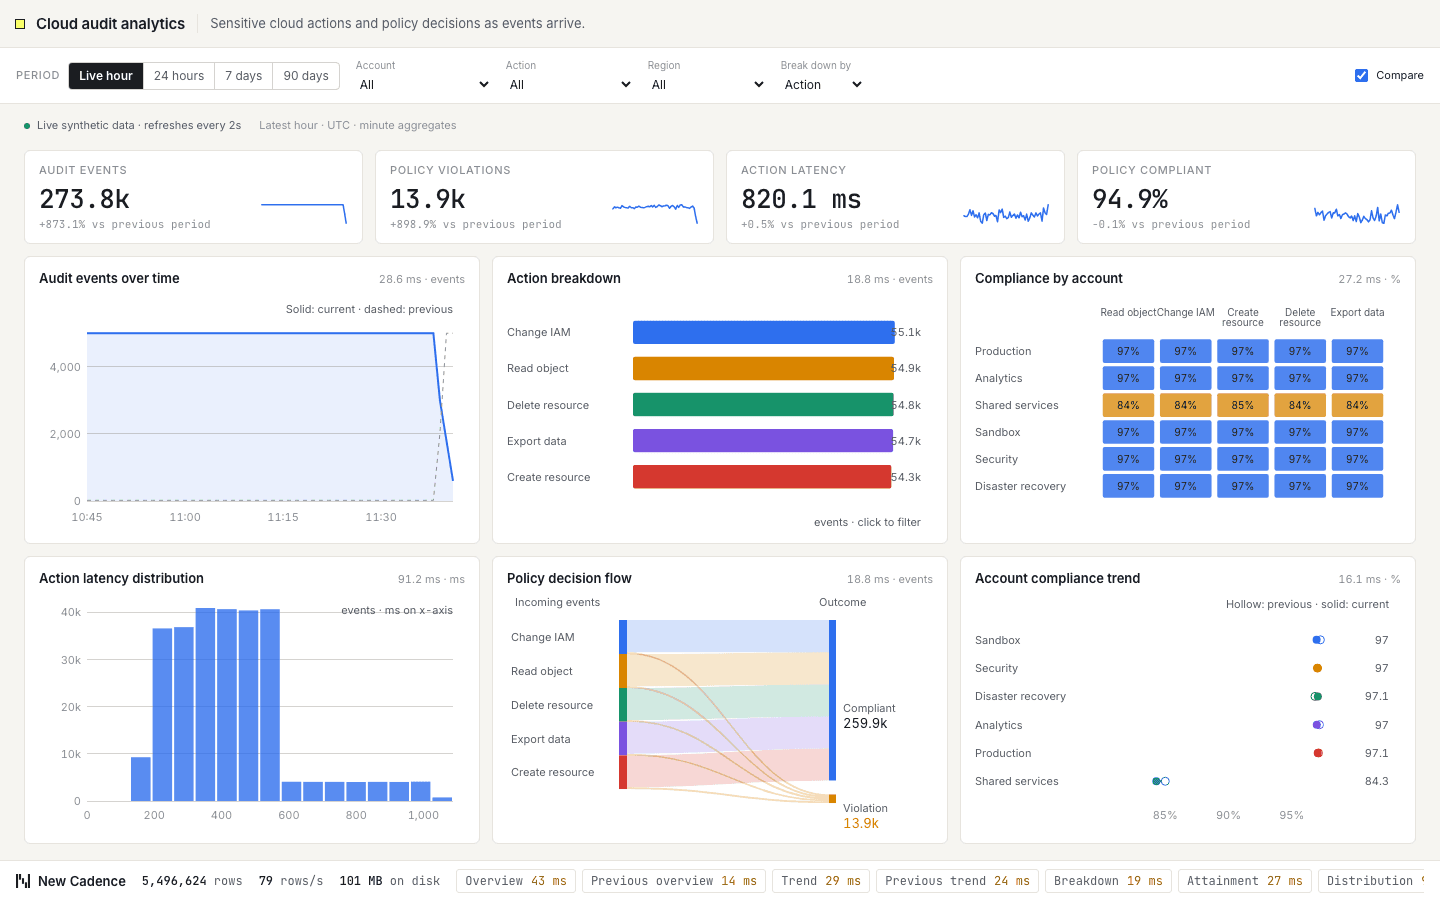
Sensitive cloud actions and policy decisions as events arrive. Headline figures for audit events, policy violations, action latency and policy compliant sit above six charts, including audit events over time, events by action and compliance by account. Filter by account or action, change the period, compare with the previous one, and every chart re-queries. ClickHouse answers each cut from minute-level rollups as new events stream in.
 23
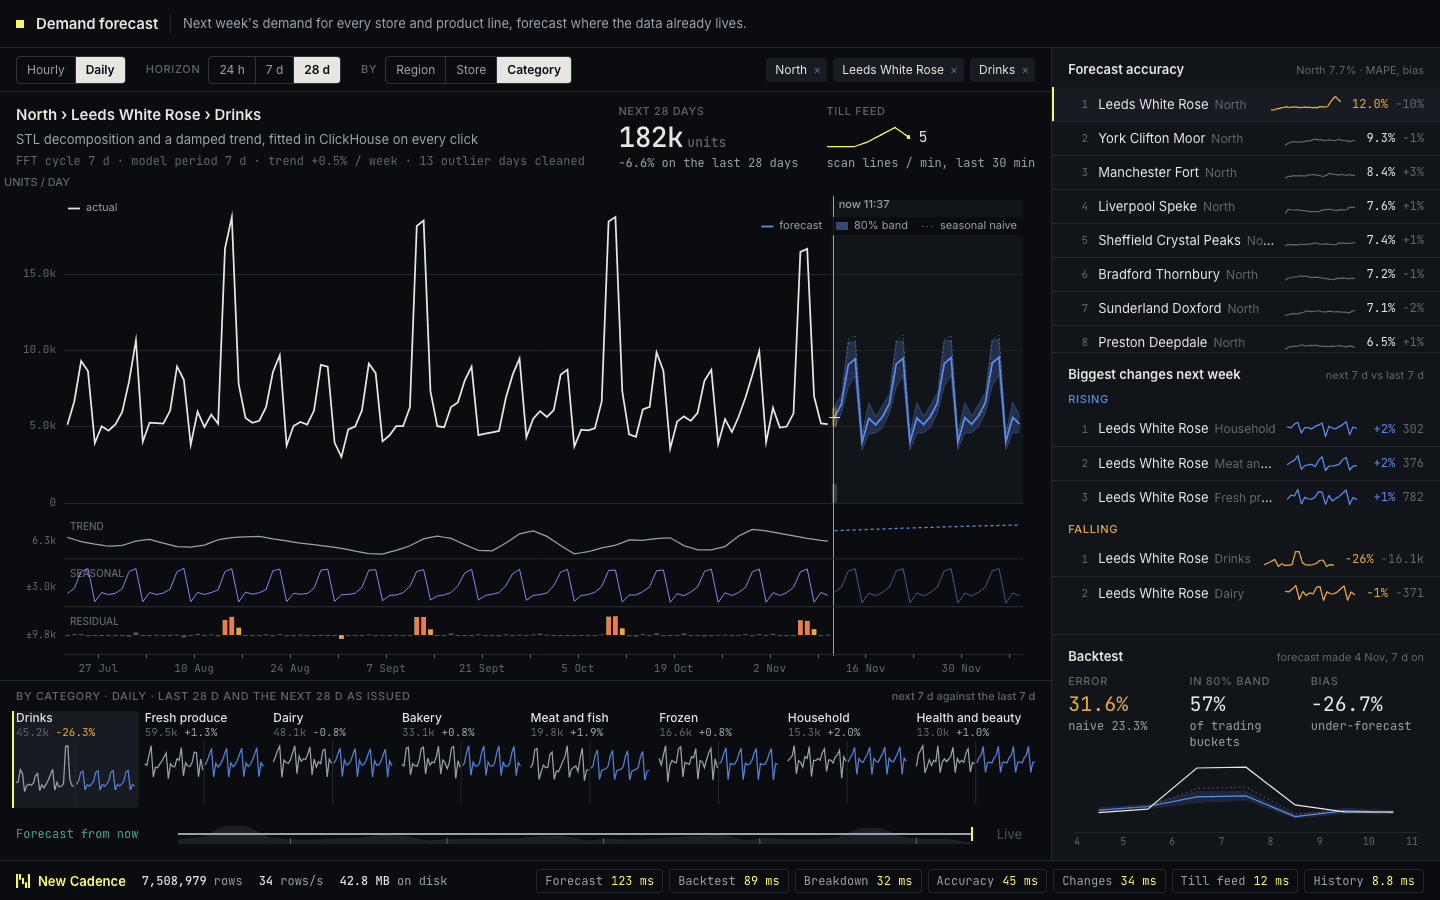
Demand for every store and product line as one large chart: actual sales up to now, then the forecast running forward inside a band that widens the further ahead it looks. Pick a region, store or category, change the horizon, and the forecast, its trend and its weekly pattern are recalculated on the spot. As real sales arrive they overwrite the forecast and you can see how accurate it was. ClickHouse does the forecasting itself in SQL, where the data already lives, with no separate modelling system.
 24
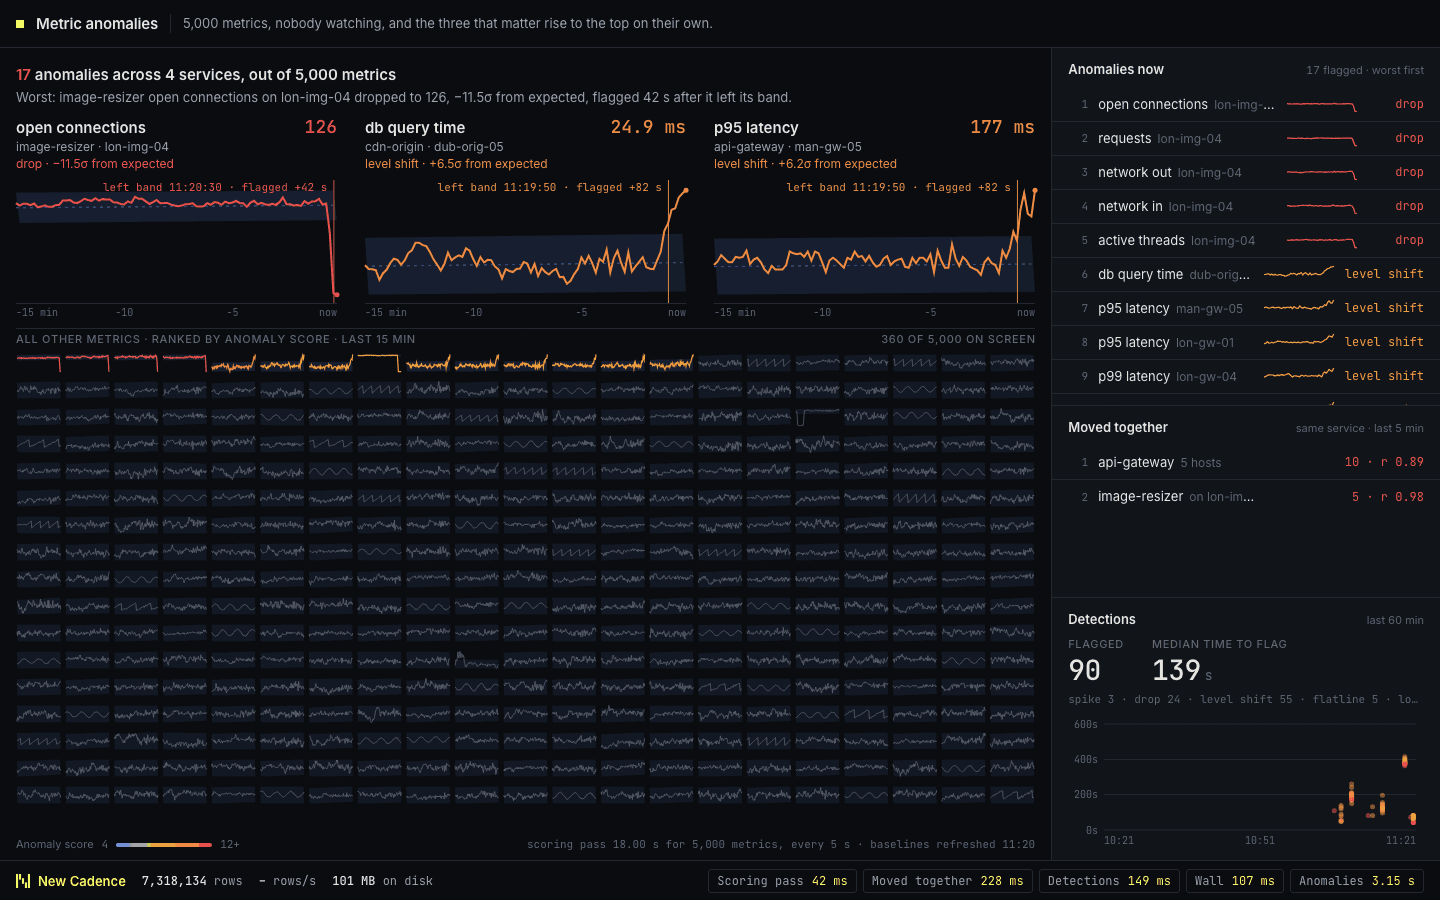
A wall of several hundred small charts, one per metric, each drawn against the range it normally stays within. Healthy metrics stay dim. When one leaves its expected range it brightens and moves to the top of the wall, so the few that matter surface on their own with nobody watching. ClickHouse learns a normal range for each metric by hour of the week, scores every metric against it every few seconds, and groups metrics that moved together.
 25
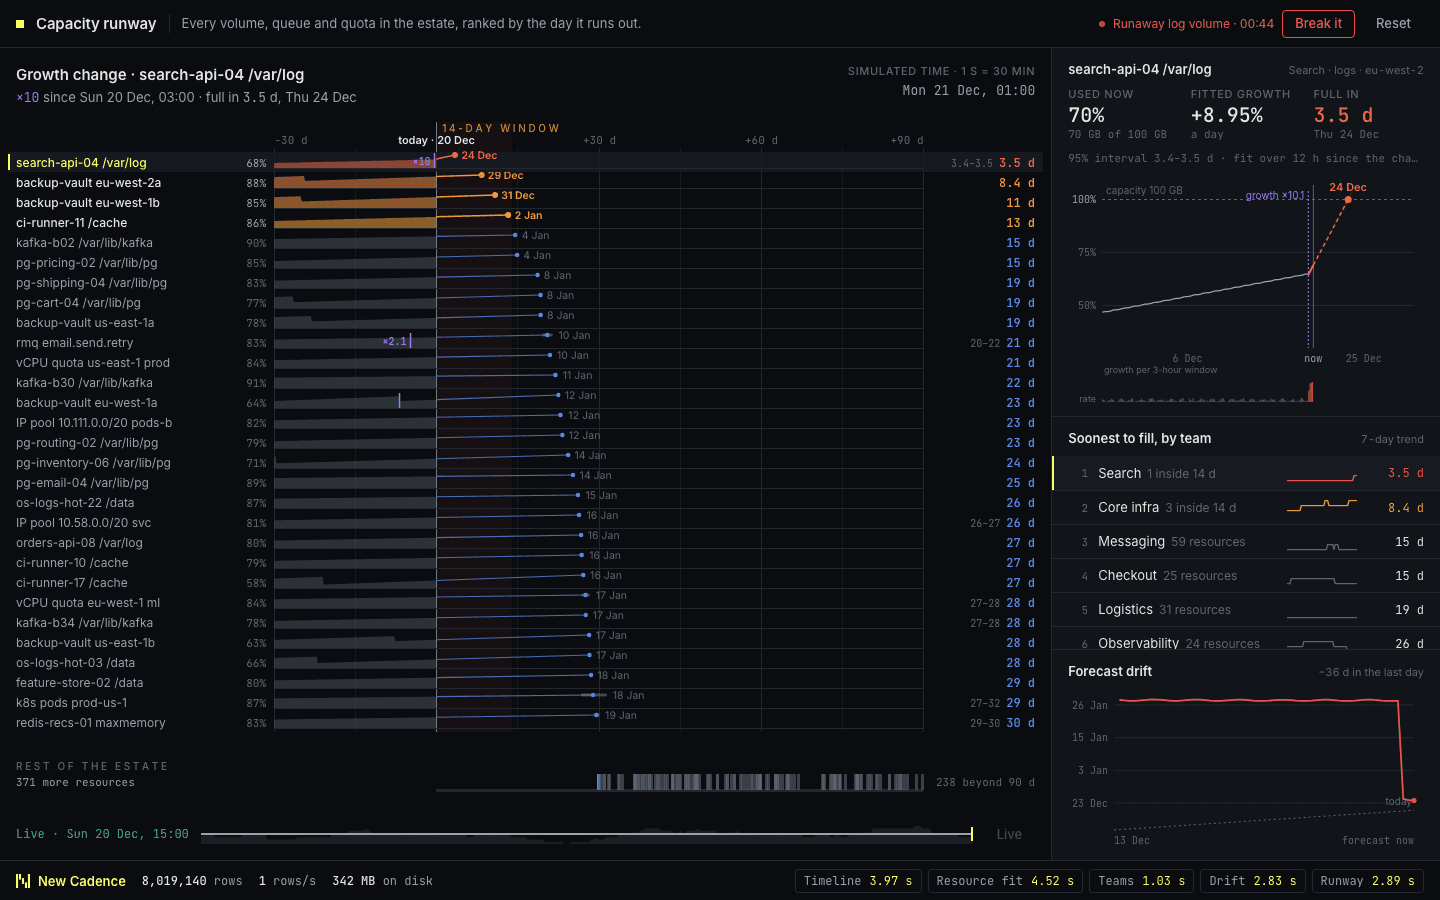
Every volume, queue and quota in the estate, ranked by the day it will run out. Each row shows usage so far and its growth projected forward to the date it crosses capacity, with anything inside two weeks highlighted. Start a runaway log volume and its projection bends, its date pulls in and it climbs the ranking. ClickHouse fits a growth line to each resource in SQL, works out the crossing date, and spots the moment growth changed.
 04
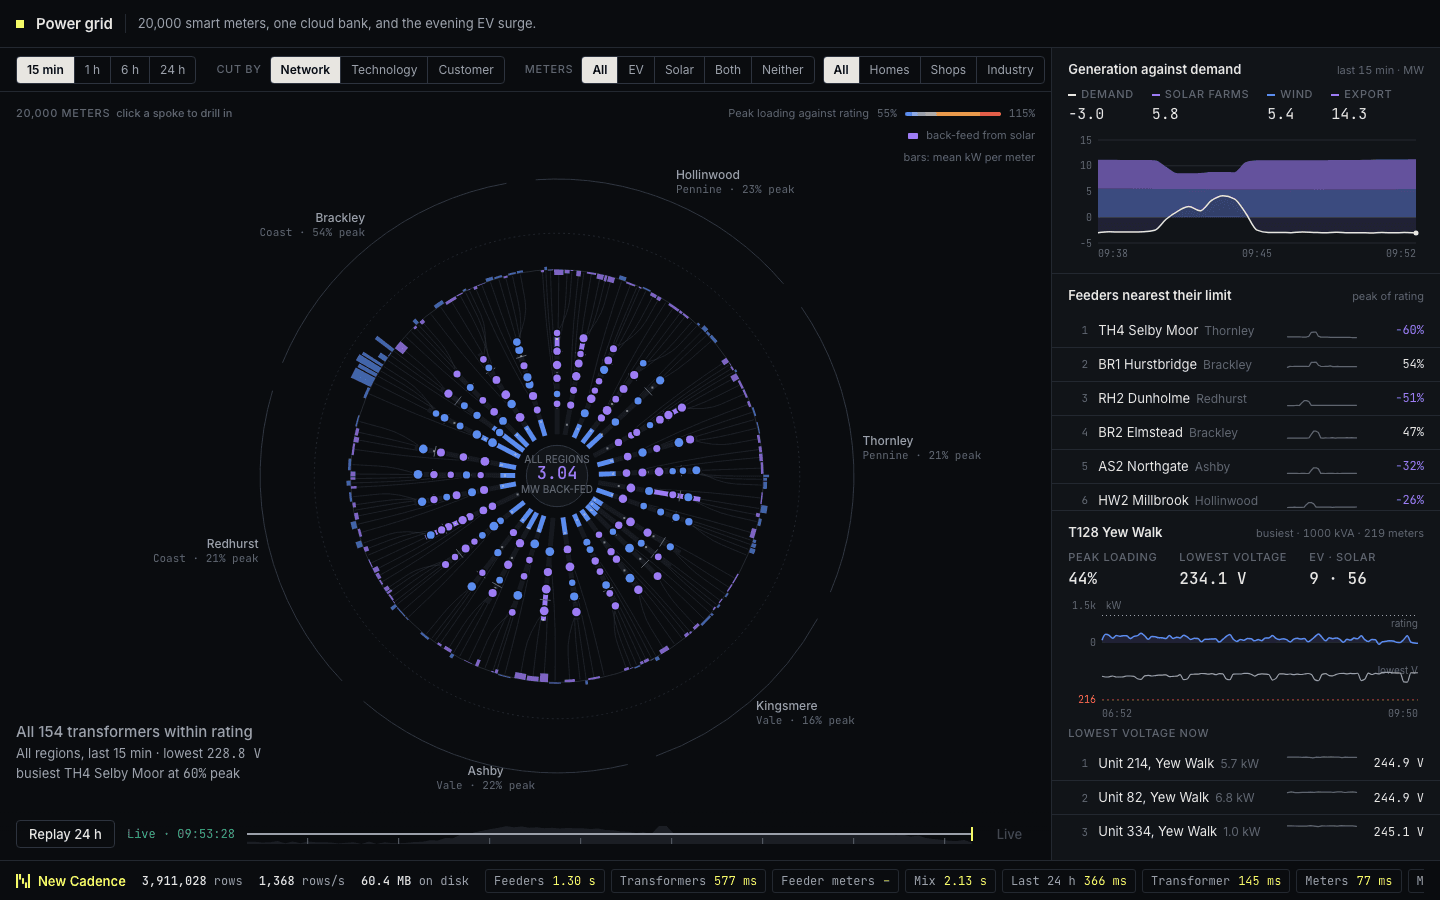
Twenty thousand smart meters drawn as a radial tree, from regions through substations, feeders and transformers out to individual meters, each branch showing how close it is to its rating. There is nothing to break here: you explore. Switch the time range, re-cut the network by technology or customer type, filter to EV or solar homes, and click down to a single meter, with every panel re-querying as you go. ClickHouse chains rollups from raw readings to minute summaries and uses projections so questions about one meter and about a whole region are both answered from the same table.
 06
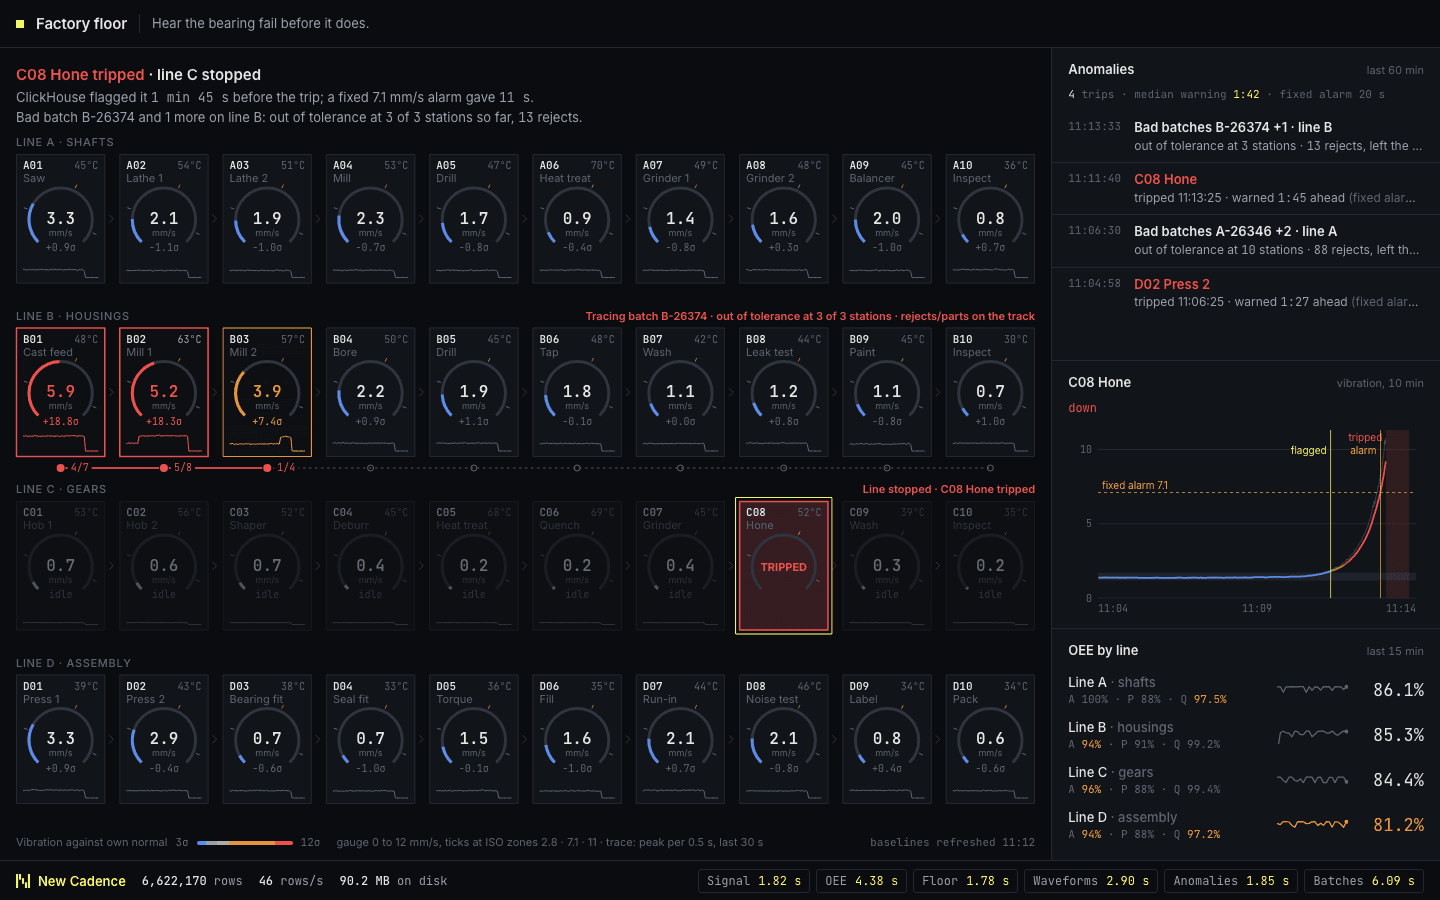
Forty machines across four production lines, each with a live gauge and trace of vibration and temperature. Wear a bearing and the anomaly feed flags it well before the machine fails, and a bad batch can be followed as it degrades every machine downstream. ClickHouse takes high-rate sensor data through asynchronous inserts, computes moving averages and anomaly scores in SQL, and downsamples signals for charting.
 15
Hexagonal fire-arrival zones, settlements and shelter routes, with a wind rose and population exposure alongside. Shift the wind or start a spot fire to shorten evacuation windows. ClickHouse expands an illustrative spread model over H3 cells, counts current populations inside the danger zone and finds the nearest shelter with an open arrival window.
 16
Three thousand vehicle identities on a schematic city map, alternating between reported positions and aggregated geohash tiles. An automatic route-deviation scenario appears in the geofence and deviation evidence. ClickHouse tags GPS reports with a polygon dictionary, calculates distance from the planned route and keeps each vehicle’s latest position.
 18
A procedural land-cover raster with an automatic before-and-after sweep, measured vegetation-index changes and insured parcel exposure. Changed cells are outlined and their index histories appear alongside. ClickHouse keys parcels by S2 cell, keeps a historical reference index and intersects affected property polygons with the exposure zone.
 14
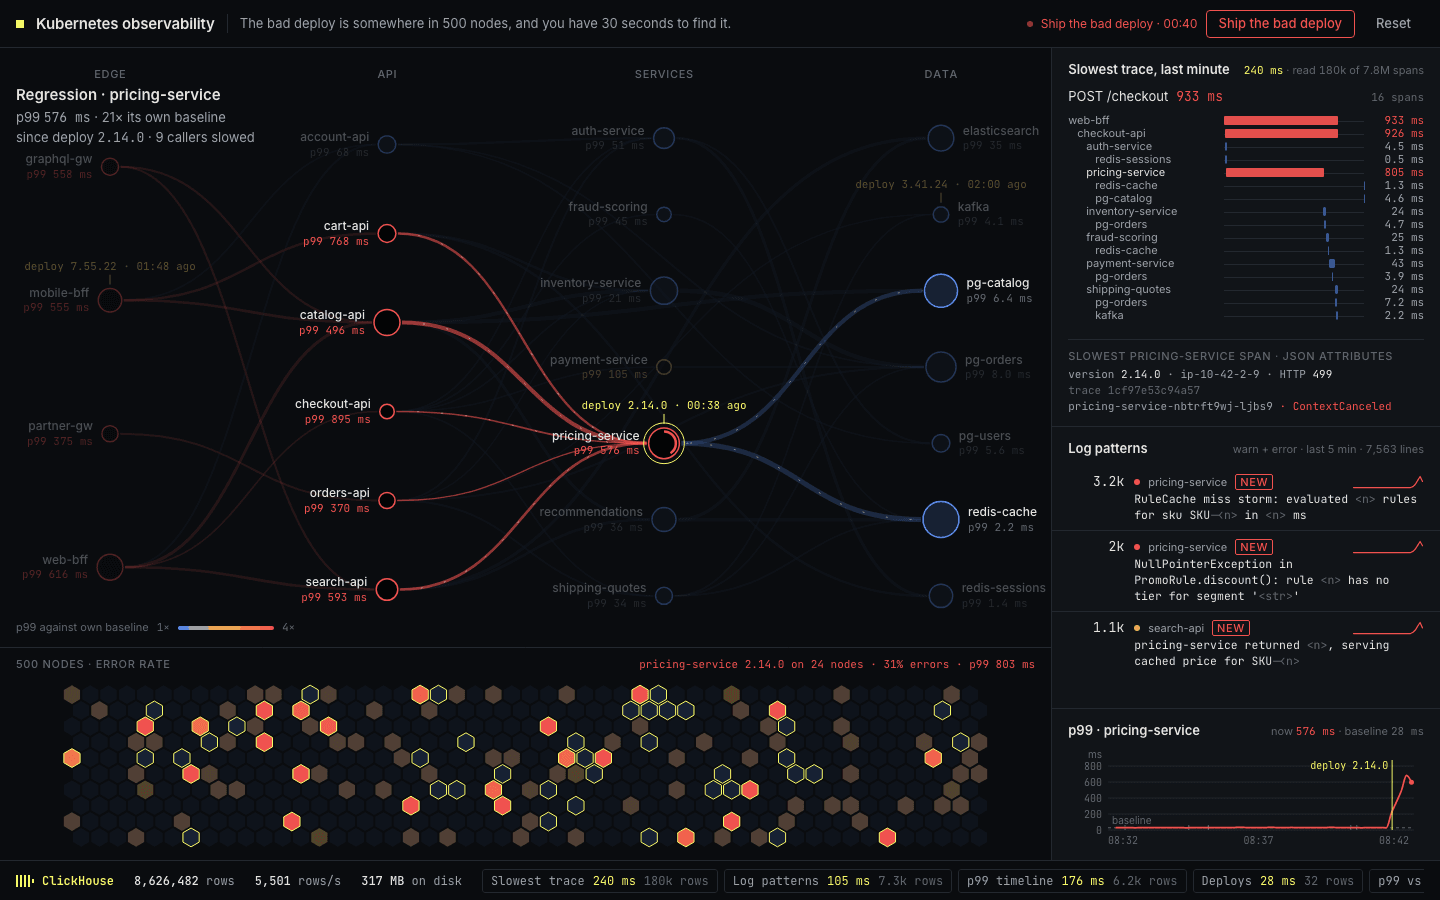
A map of services and the calls between them, sitting above a grid of 500 nodes shaded by error rate. Ship the bad deploy and you have 30 seconds to find it as latency climbs and errors spread, with the slowest trace one click away and logs grouped into similar errors. ClickHouse stores every request as a wide event, computes weighted latency percentiles, and clusters log lines into patterns in SQL.
 21
A video-streaming quality matrix by ISP and CDN, with viewers and bitrate bands above it. Automatic CDN brownouts and peering faults appear as failing columns or rows. Drill into regions, cities and edge sites while ClickHouse merges heartbeat rollups, startup-time quantiles and the sequence of viewers stalling and leaving.
 22
Token streams by team, application, model or provider, with spend against budget, model latency, cache savings and costly sessions alongside. Automatic agent loops inflate a stream; drill into a session to inspect repeated tool calls. ClickHouse rolls up tokens and cost, merges latency quantiles and detects repeated calls from wide request events.
 29
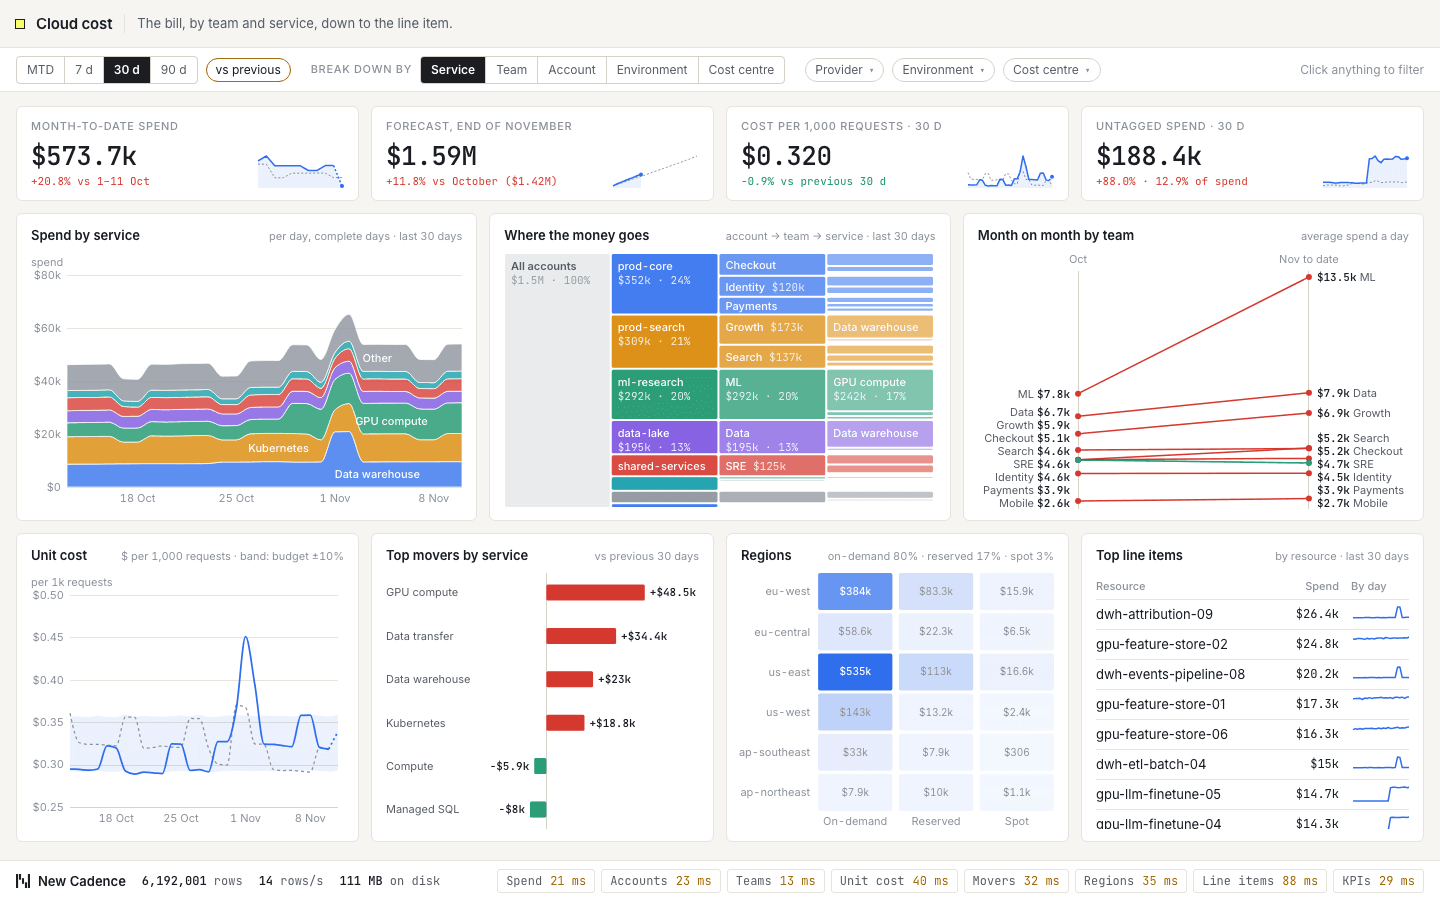
The cloud bill by team and service, down to the line item. Daily spend by service, an account-to-team-to-service breakdown, the biggest movers this month and cost per thousand requests against budget. Filter by provider, account, team, environment or tag to see who is spending what. ClickHouse rolls up billing lines, keeps tags in a map column and projects the month-end total.
 39
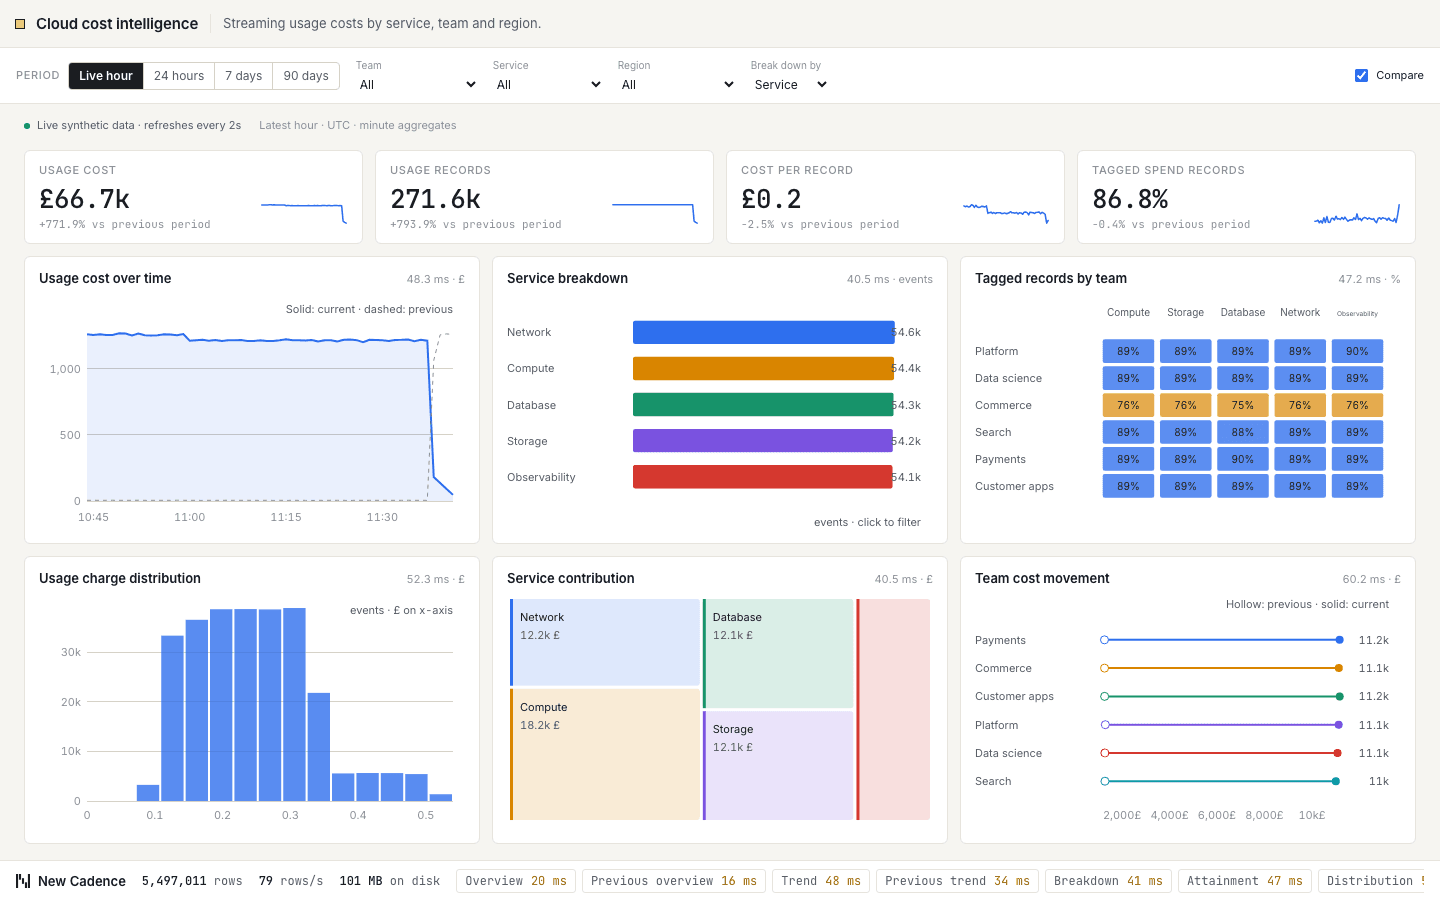
Streaming usage costs by service, team and region. Headline figures for usage cost, usage records, cost per record and tagged spend records sit above six charts, including usage cost over time, cost by service and tagged records by team. Filter by team or service, change the period, compare with the previous one, and every chart re-queries. ClickHouse answers each cut from minute-level rollups as new events stream in.
 41
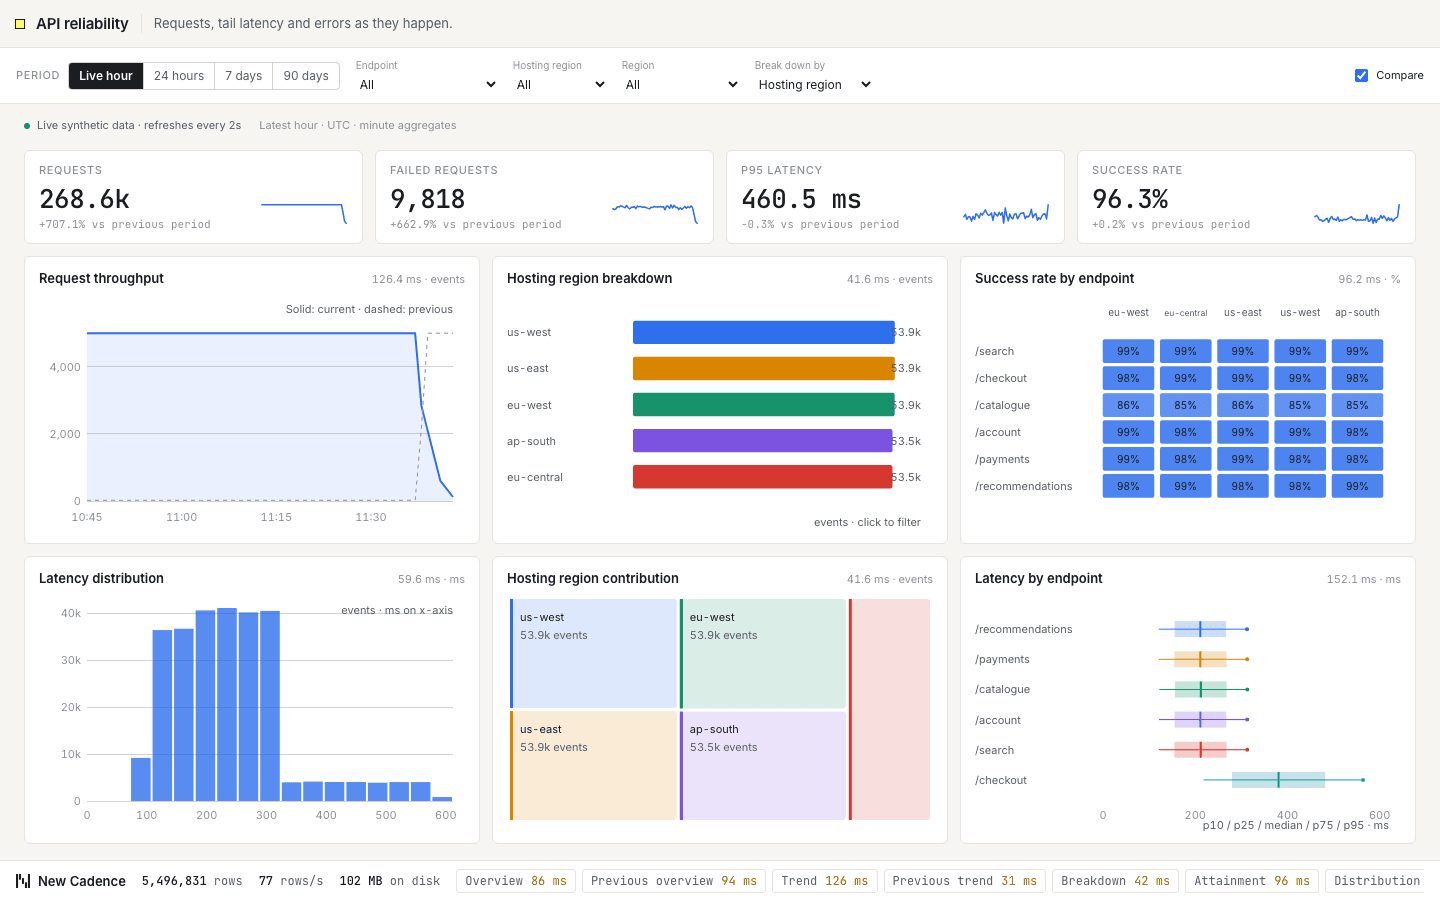
Requests, tail latency and errors as they happen. Headline figures for requests, failed requests, p95 latency and success rate sit above six charts, including request throughput, requests by region and success rate by endpoint. Filter by endpoint or hosting region, change the period, compare with the previous one, and every chart re-queries. ClickHouse answers each cut from minute-level rollups as new events stream in.
 02
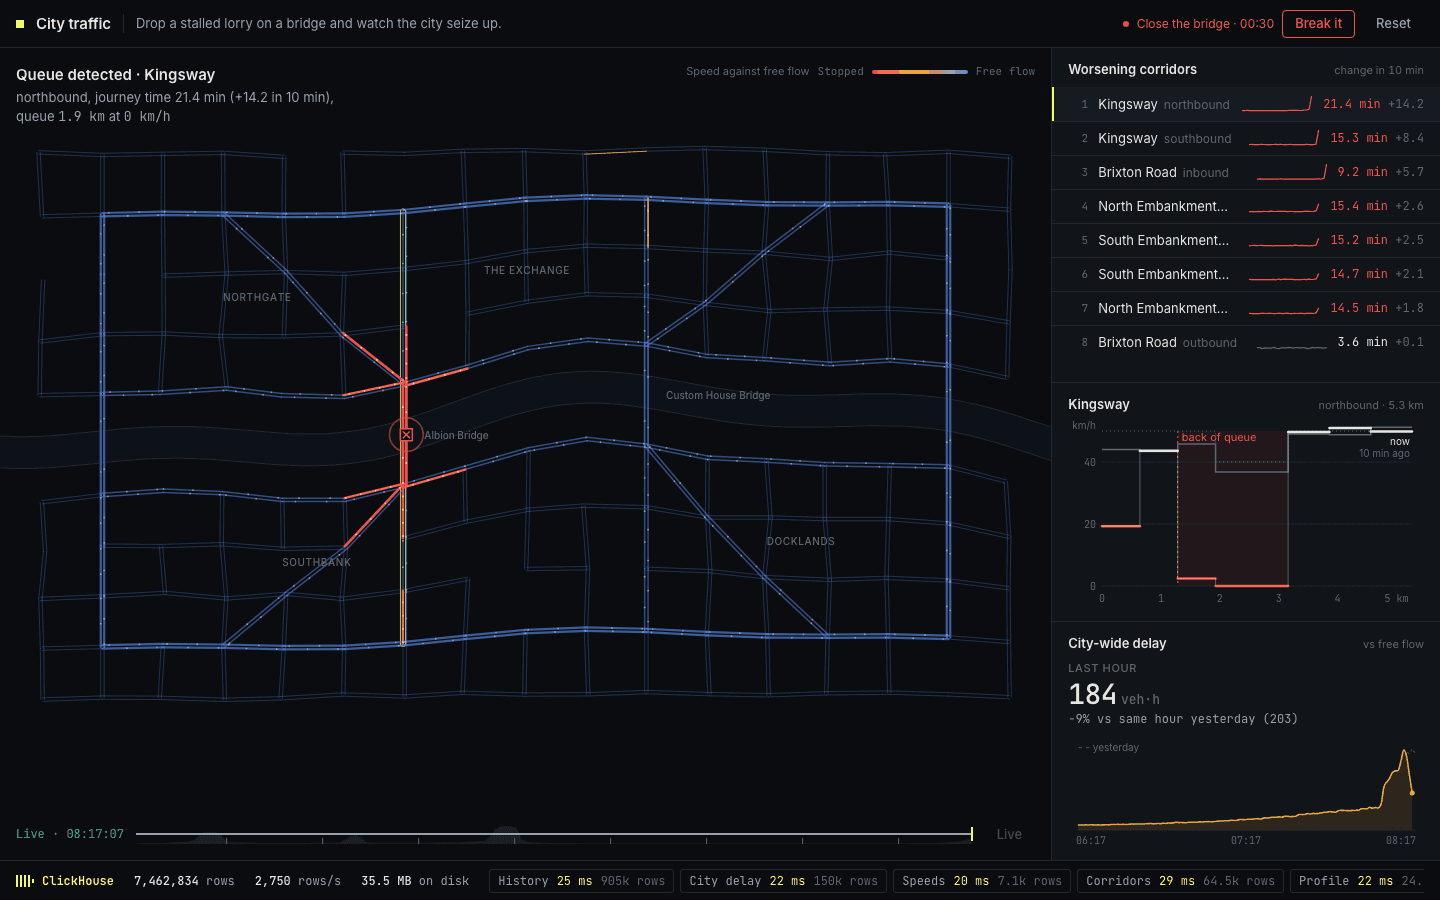
A city of roads, bridges and a ring road, each segment coloured by how its speed compares with free flow. Drop a stalled lorry on a bridge or close it outright, and the congestion travels visibly upstream until the city seizes up. A time slider replays any moment of the day. ClickHouse rolls up every road segment into ten second buckets and uses window functions to measure how speed changes along a route.
 08
A world map of port queues and container traffic, with an automatic canal-closure scenario that builds pressure at connected ports. The queue ranking, container scan history and port-call funnel update alongside the map. ClickHouse classifies port observations with geofences, retains the latest scan and reconstructs arrival, berth, unload and departure sequences.
 09
Ward occupancy, patient flow and a four-hour pressure outlook across emergency, assessment, ICU, theatres and inpatient wards. Start a flu wave or motorway incident and watch pressure build, then reset or replay the history. ClickHouse keeps patient state, projects bed shortfalls, measures emergency waits and checks ordered sepsis care bundles.
 13
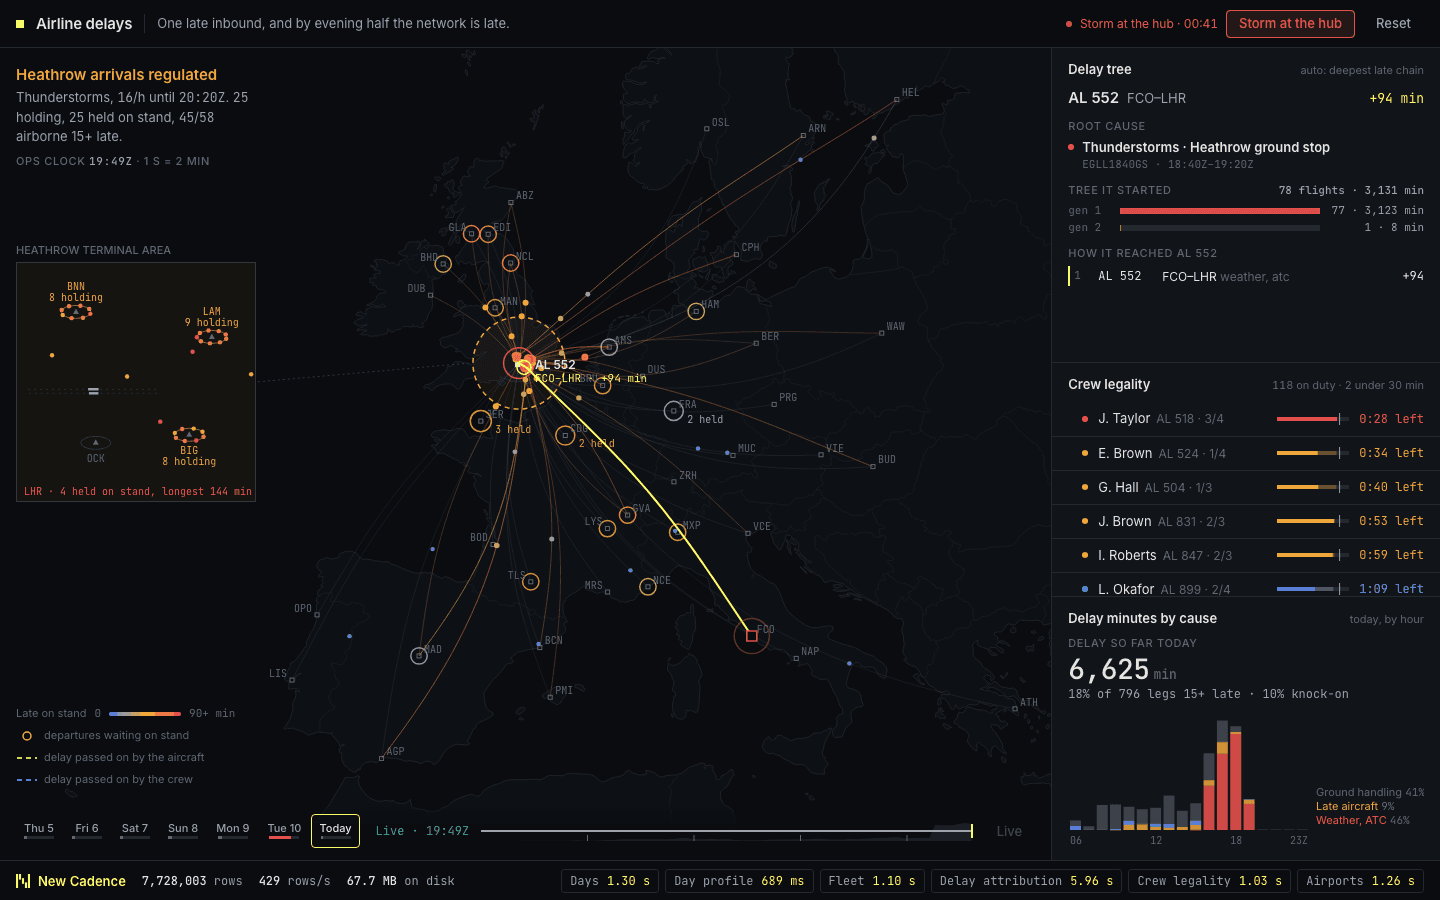
An airline network with aircraft moving between hubs, coloured by how late they are running. Select a late flight and its delay is traced back through the aircraft’s earlier rotations and connecting crew to the root cause. Trigger a storm at the hub and watch the delay spread through the evening schedule. ClickHouse expands each aircraft’s rotation chain into rows and lets you replay yesterday’s disruption minute by minute.
 17
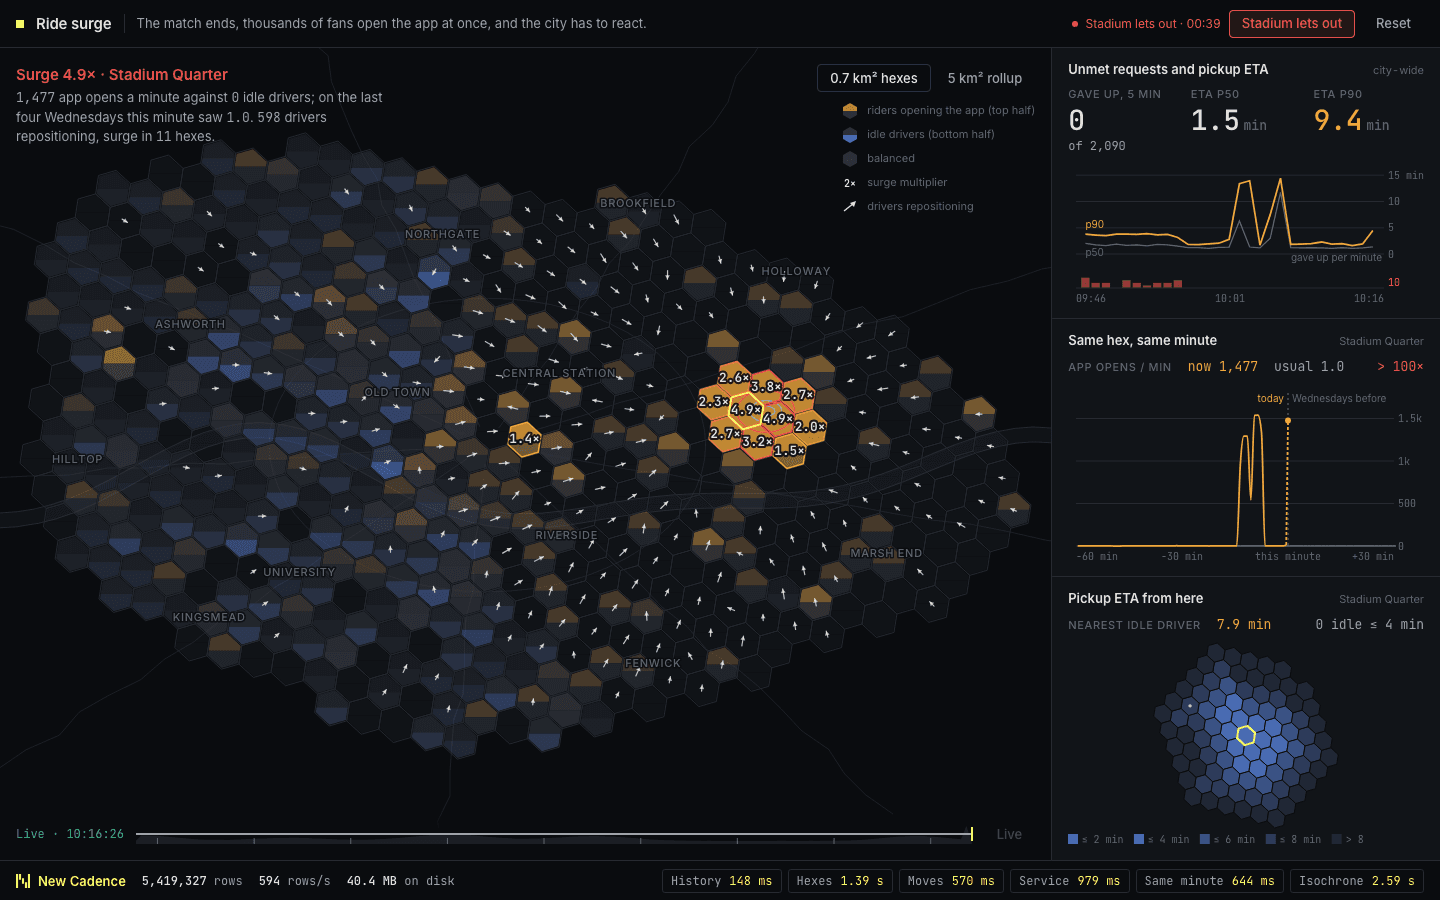
A city divided into hexagons, each showing the balance between riders waiting and drivers available, with surge prices in the busiest areas. Let the stadium out and 40,000 people want a car at once, and you watch drivers reposition to meet them. ClickHouse aggregates demand and supply into five second buckets on a hexagonal grid and compares each area with the same minute on previous Saturdays.
 30
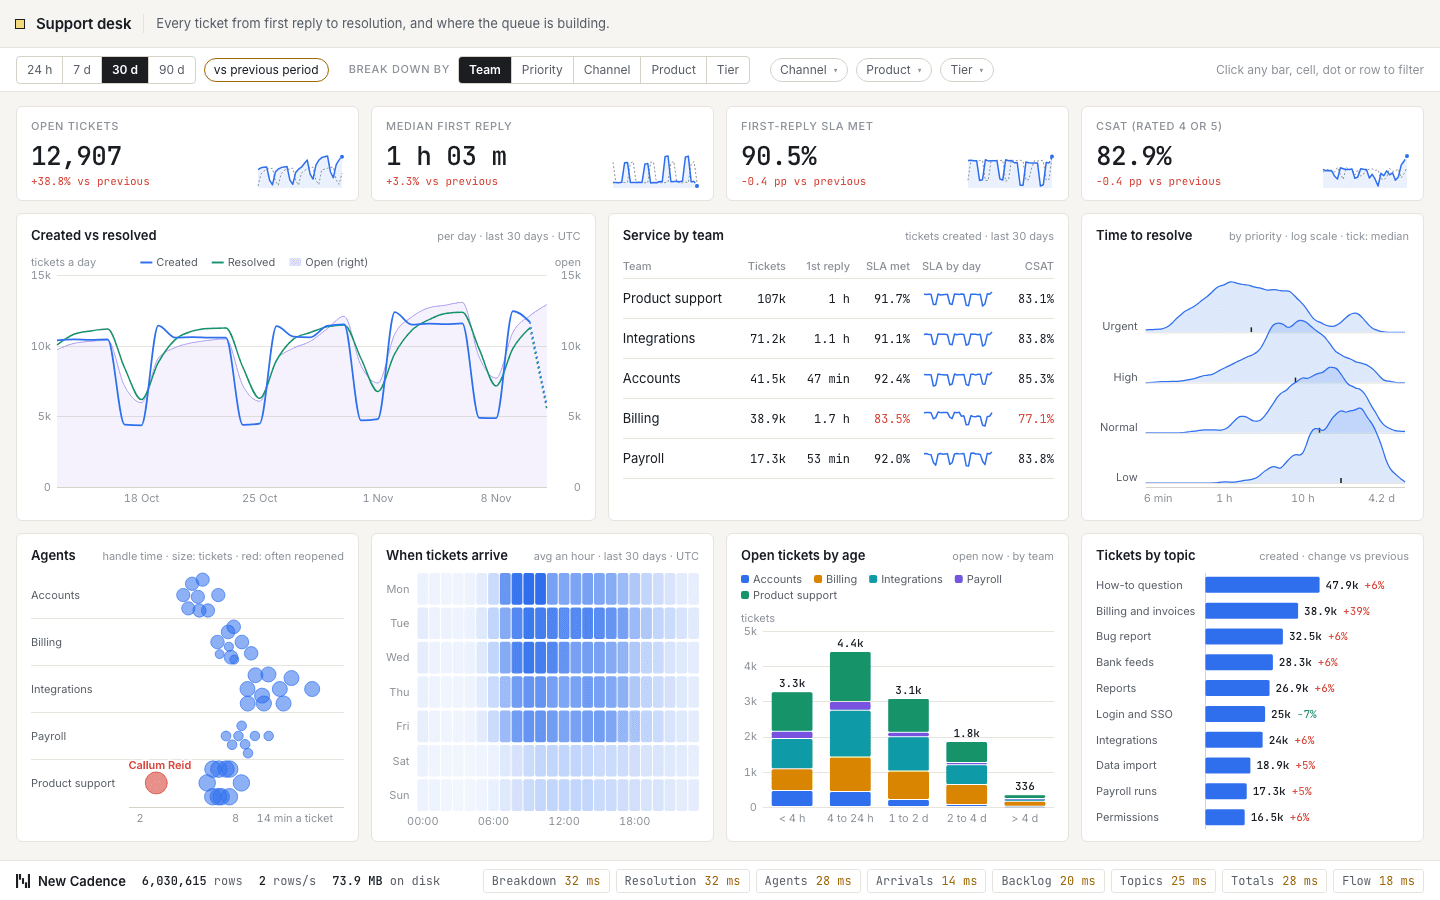
Every support ticket from first reply to resolution, and where the queue is building. Tickets arriving against tickets resolved, an hour-by-weekday view of demand, resolution times by priority, the age of the backlog and how individual agents compare. Slice by channel, priority, product, team or customer tier. ClickHouse tracks the latest state of each ticket and computes response-time percentiles as you filter.
 31
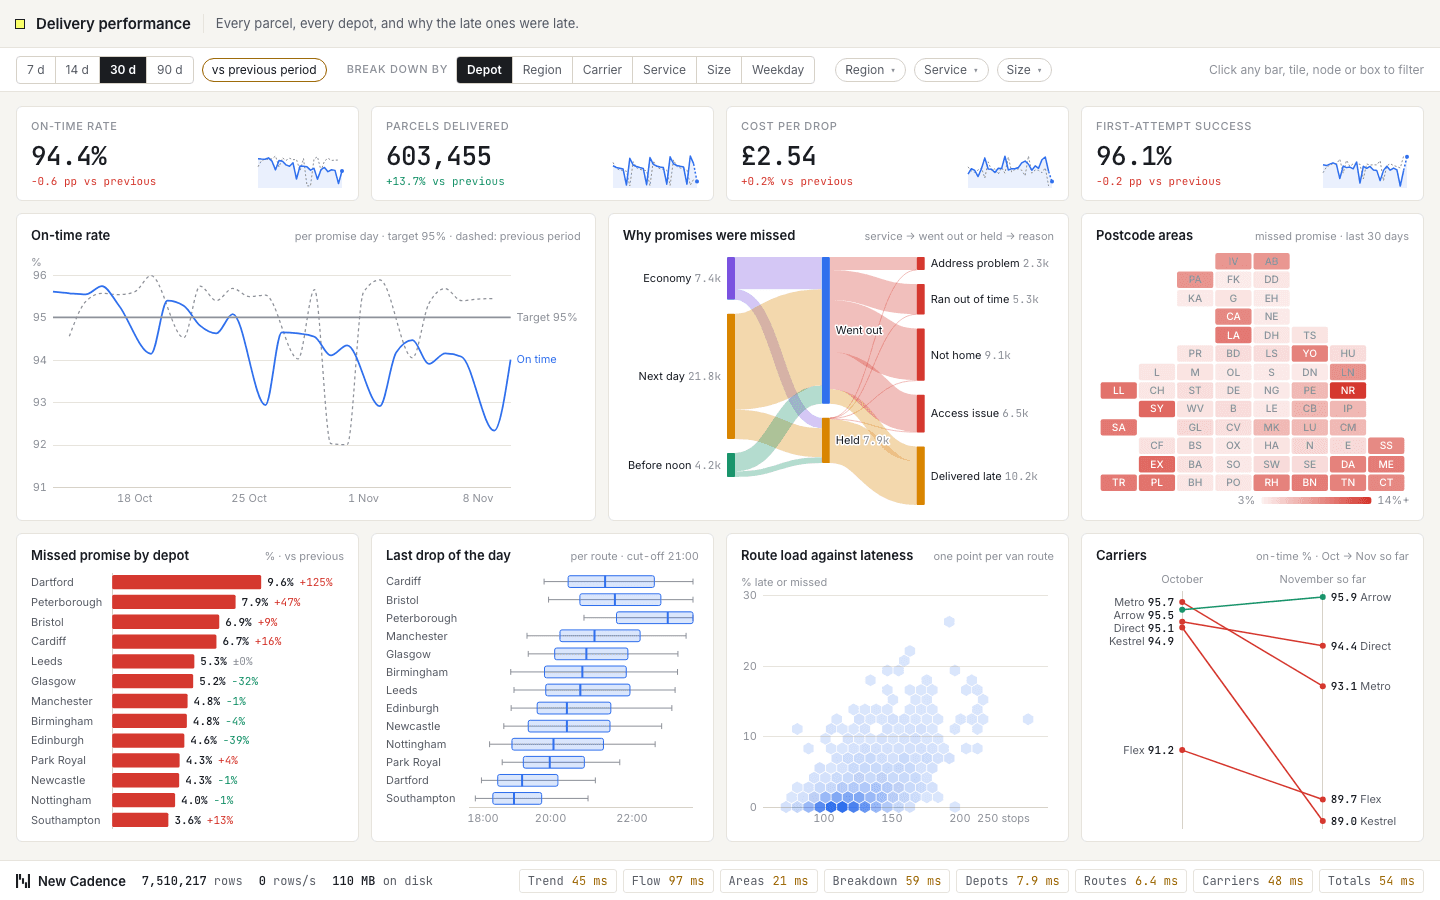
Every parcel and every depot, and why the late ones were late. On-time rate against target, lateness by depot, the path from dispatch to delivered or failed with reasons, a tile map of postcode areas and how carriers compare with last month. Filter by depot, carrier, service level or parcel size. ClickHouse keeps on-time ratios in rollups and works out each delivery stage from the scan events.
 37
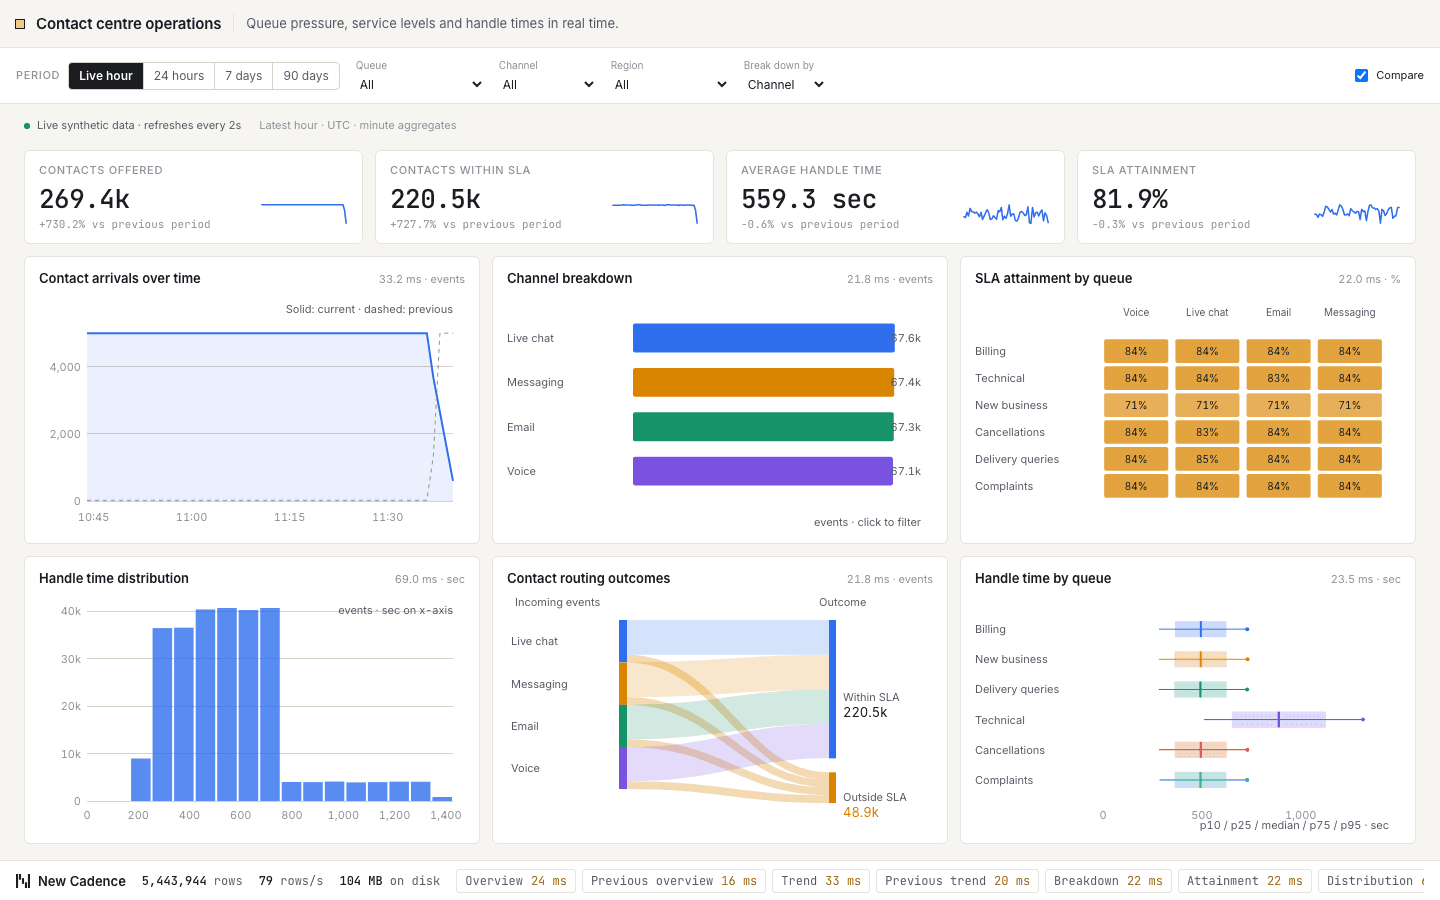
Queue pressure, service levels and handle times in real time. Headline figures for contacts offered, contacts within sla, average handle time and sla attainment sit above six charts, including contact arrivals over time, contacts by channel and sla attainment by queue. Filter by queue or channel, change the period, compare with the previous one, and every chart re-queries. ClickHouse answers each cut from minute-level rollups as new events stream in.
 38
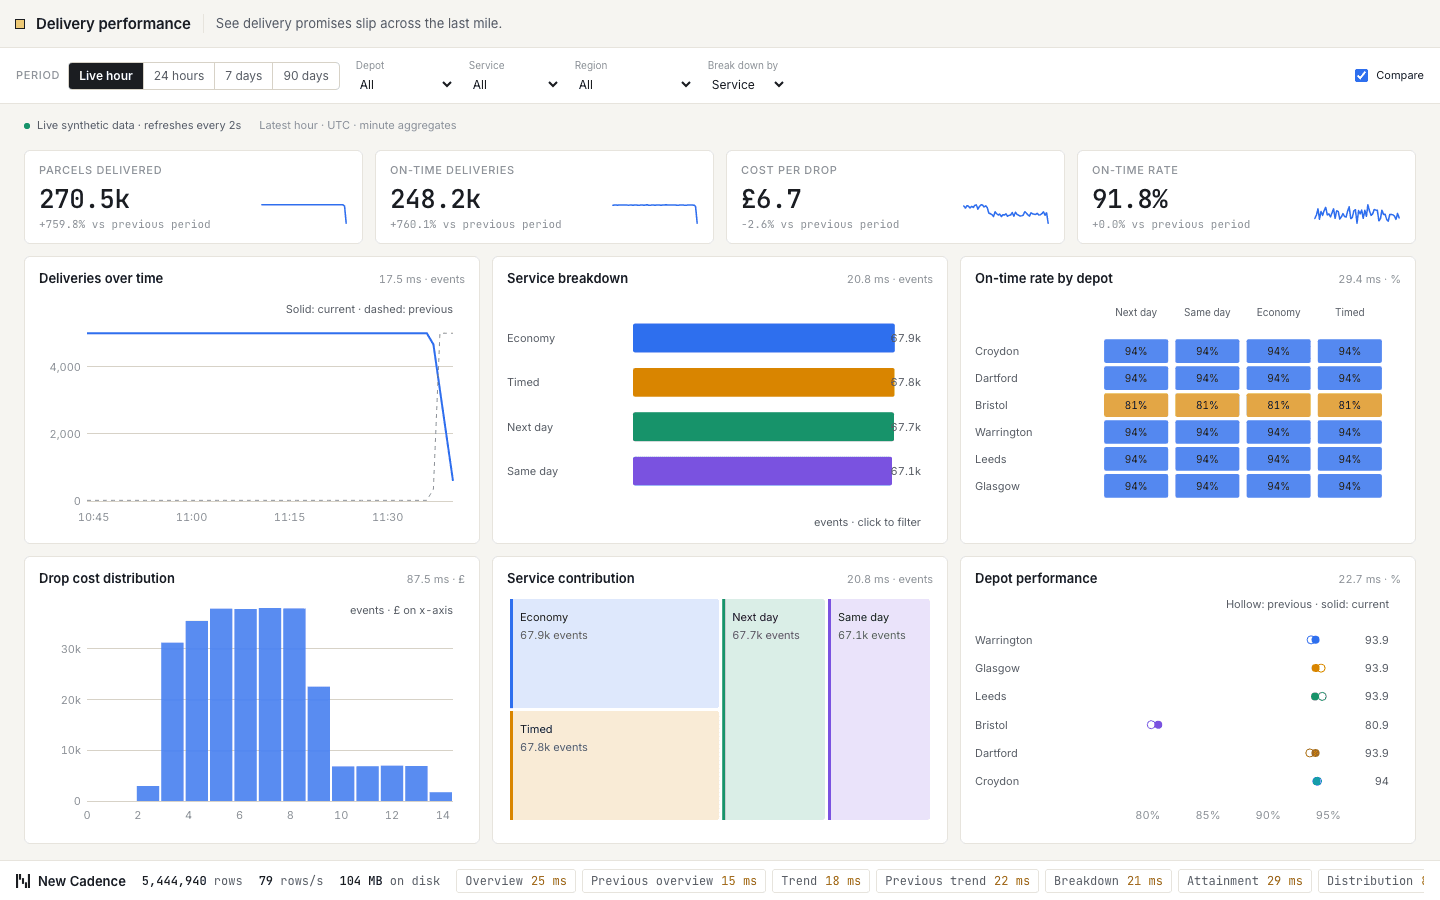
See delivery promises slip across the last mile. Headline figures for parcels delivered, on-time deliveries, cost per drop and on-time rate sit above six charts, including deliveries over time, service mix and on-time rate by depot. Filter by depot or service, change the period, compare with the previous one, and every chart re-queries. ClickHouse answers each cut from minute-level rollups as new events stream in.
 40
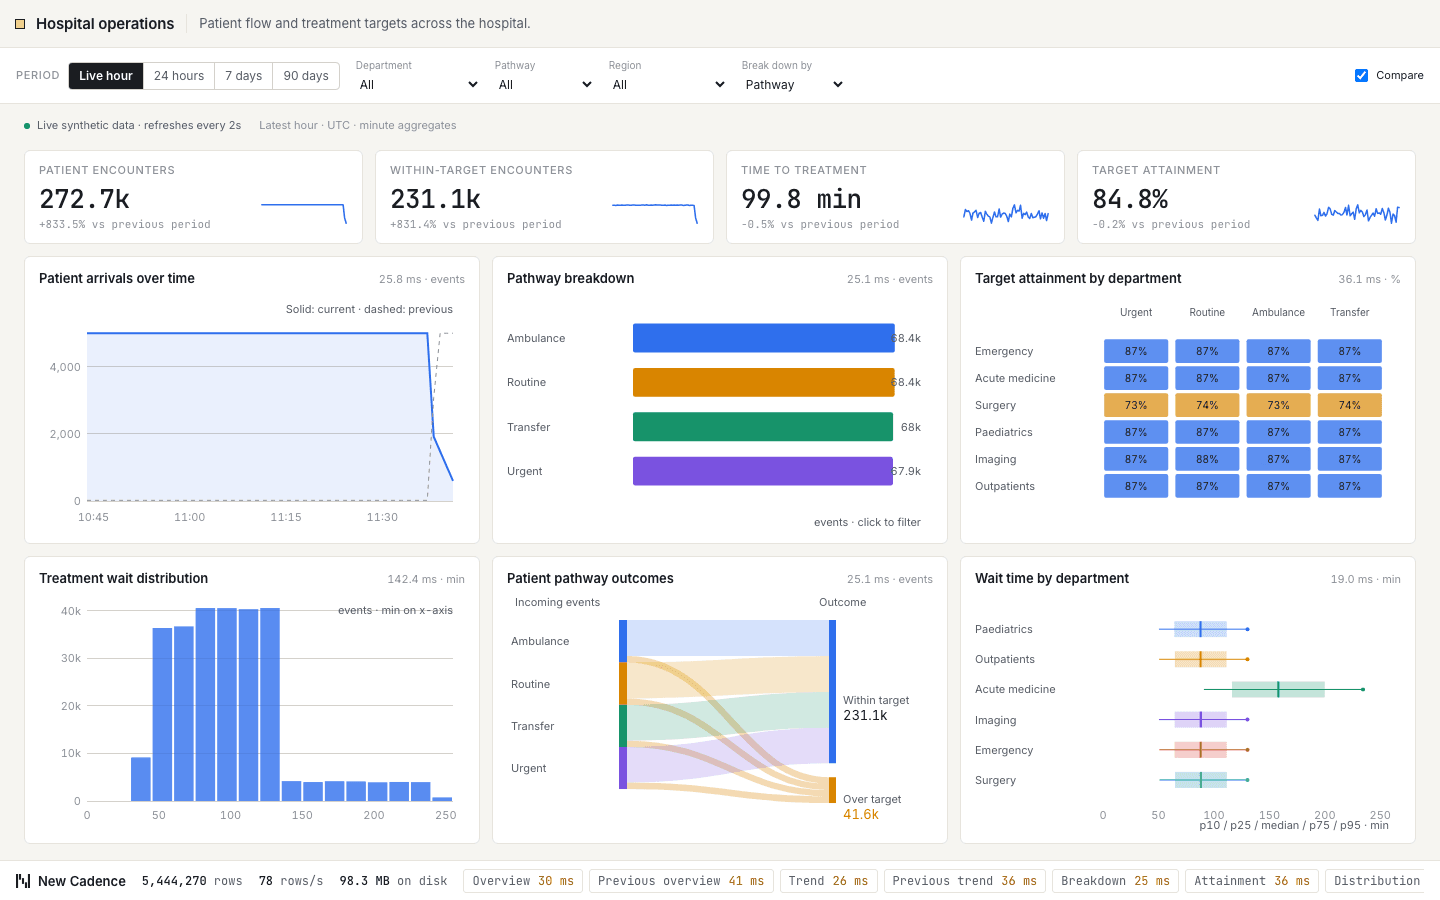
Patient flow and treatment targets across the hospital. Headline figures for patient encounters, within-target encounters, time to treatment and target attainment sit above six charts, including patient arrivals over time, pathway mix and target attainment by department. Filter by department or pathway, change the period, compare with the previous one, and every chart re-queries. ClickHouse answers each cut from minute-level rollups as new events stream in.
 20
A checkout funnel from product view to confirmed order, with cohort conversion, payment latency and inventory reservations alongside. Automatic provider slowdowns expose where sessions are lost. Filter by cohort or stage and replay history while ClickHouse reconstructs session funnels, merges unique-session states and reads the latest inventory snapshot.
 26
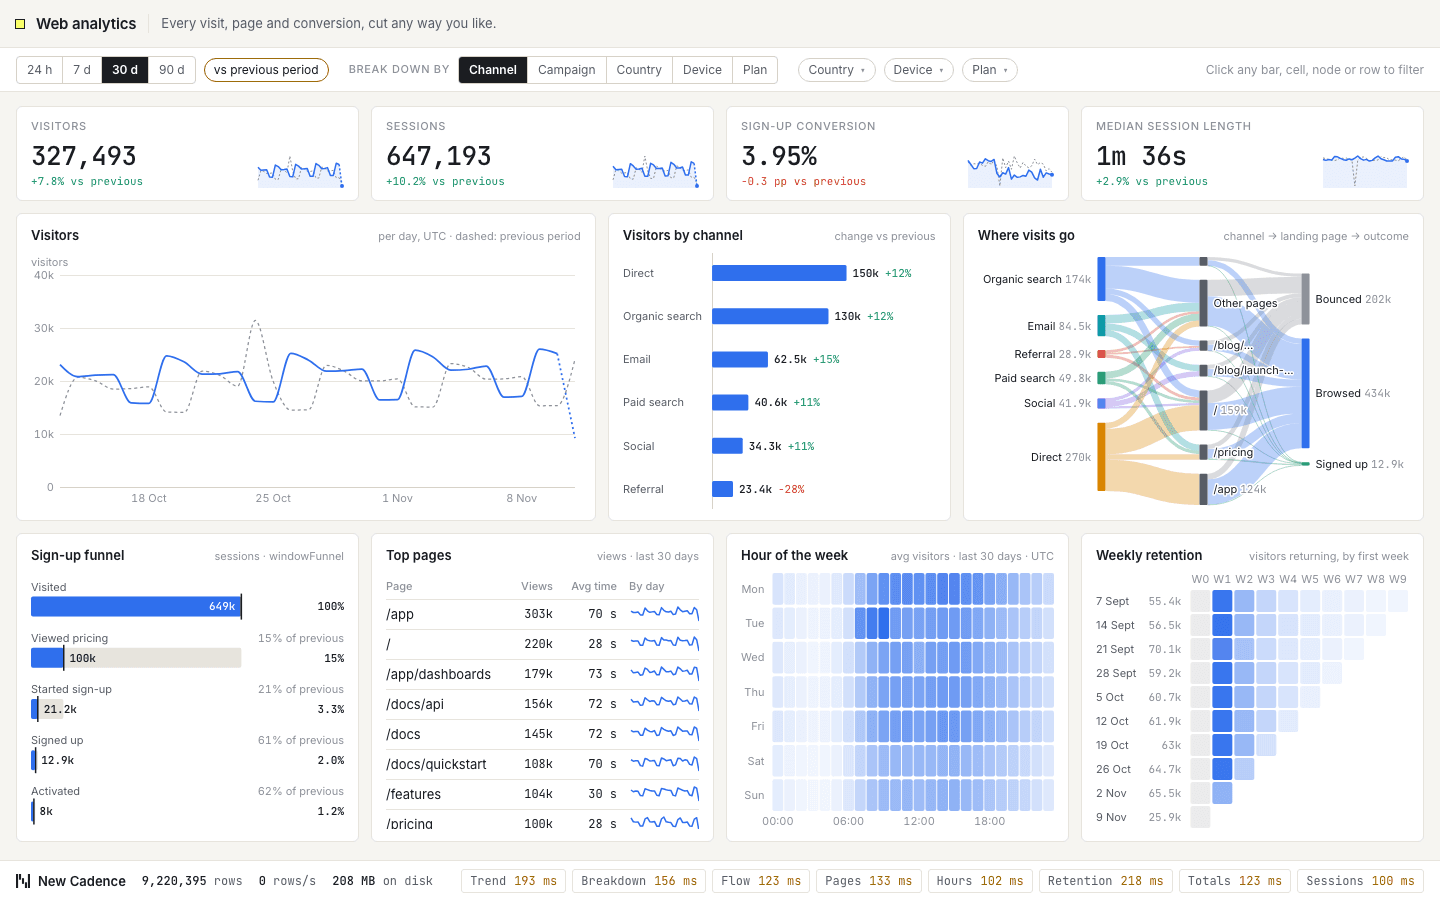
Every visit, page view and sign-up for a software product over ninety days. Headline numbers sit above visitors against the previous period, a sign-up funnel, a weekly retention triangle and a flow from traffic source to landing page to outcome. Click any channel, country, page or cell and the whole dashboard re-cuts to it. ClickHouse keeps unique-visitor rollups and builds the funnel and retention directly from raw events.
 32
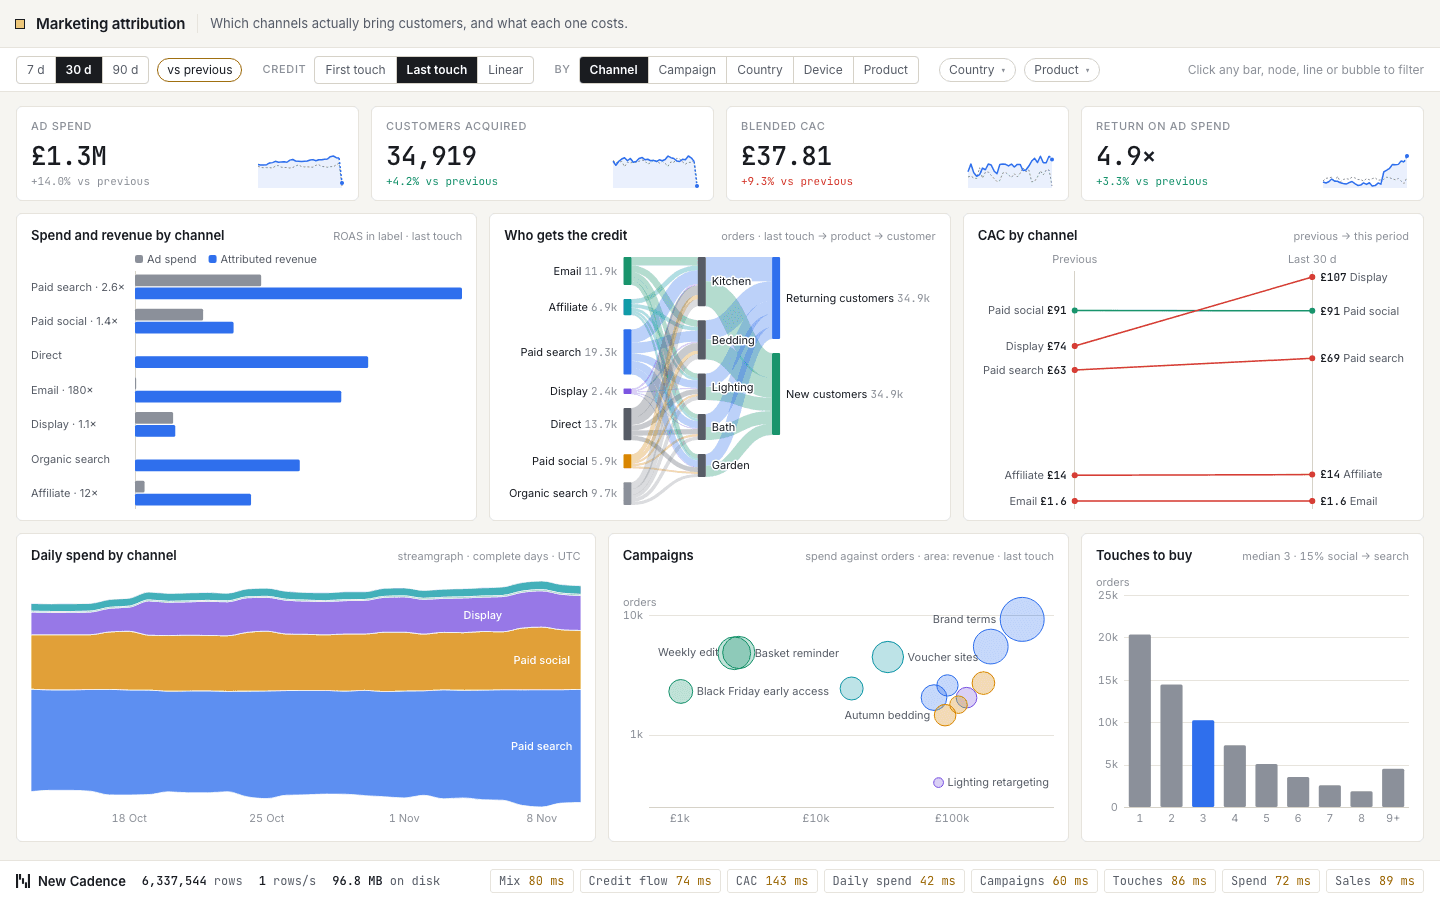
Which channels actually bring customers, and what each one costs. Spend against revenue by channel, cost to acquire a customer quarter on quarter, and a flow from touchpoints to conversion that re-cuts when you switch between first-touch, last-touch and linear attribution. Slice by channel, campaign, country or product line. ClickHouse assembles each customer journey from raw touchpoints and shares out the credit in SQL.
 42
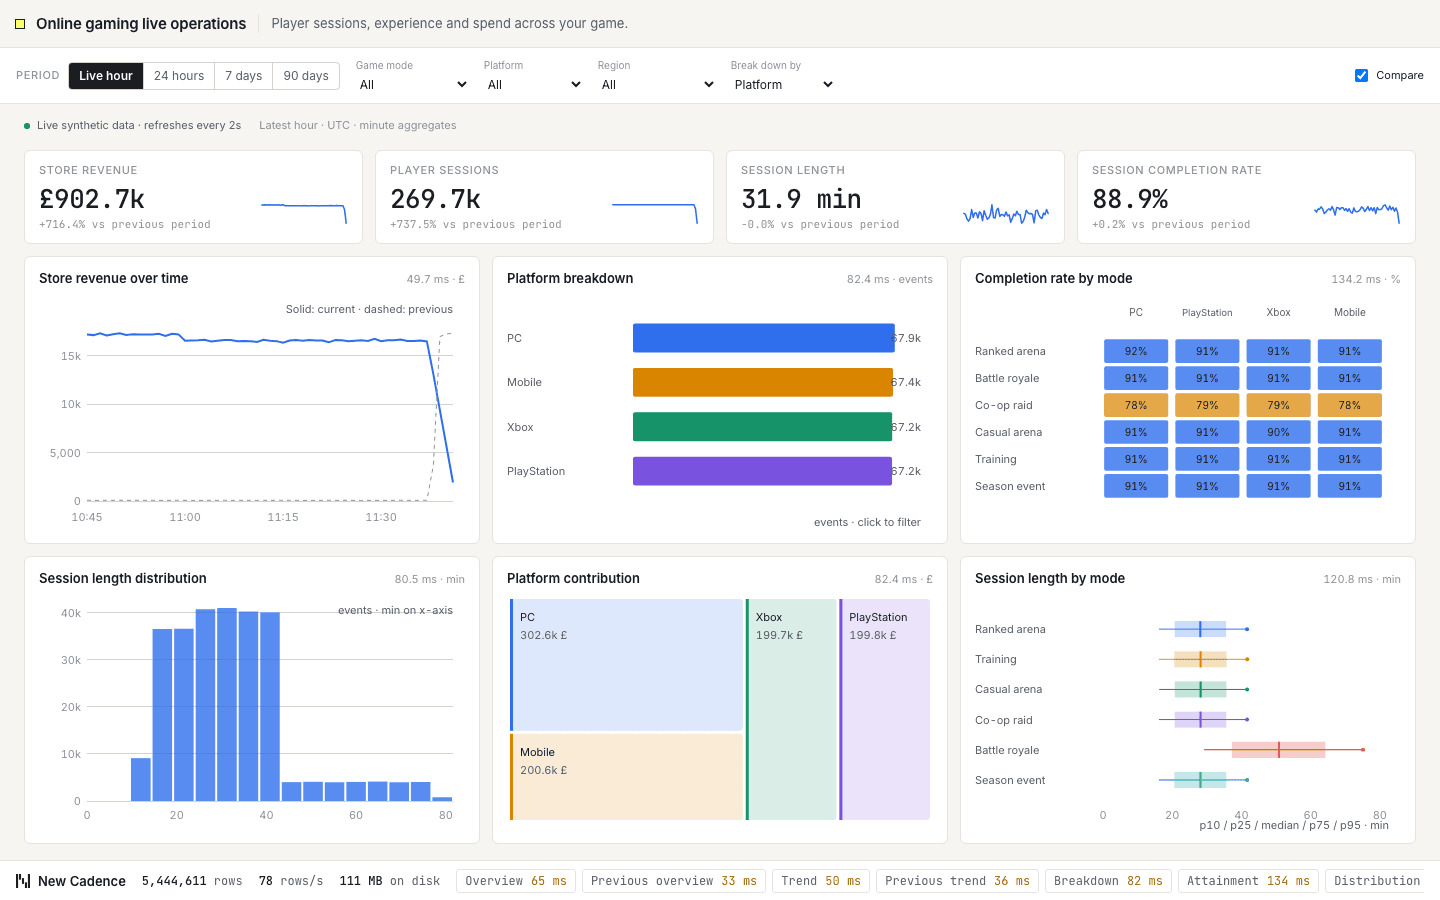
Player sessions, experience and spend across your game. Headline figures for store revenue, player sessions, session length and session completion rate sit above six charts, including store revenue over time, sessions by platform and completion rate by mode. Filter by game mode or platform, change the period, compare with the previous one, and every chart re-queries. ClickHouse answers each cut from minute-level rollups as new events stream in.
 05
A live match market with odds, stake depth and payout liability for three outcomes. Automatic market moves reshape the book, while filters let you compare device and country cohorts or replay an earlier period. ClickHouse attaches the prevailing odds to each bet with an ASOF JOIN, keeps the latest quotes and measures the stake distribution.
 10
A live ad exchange with a bidder-to-publisher chord, auction tape, campaign reach and suspicious traffic evidence. Filter by country or device, drill into publishers, sites, bidders and campaigns, and replay the archive. ClickHouse rolls up spend, merges approximate unique reach and detects addresses requesting ads in lockstep.
 27
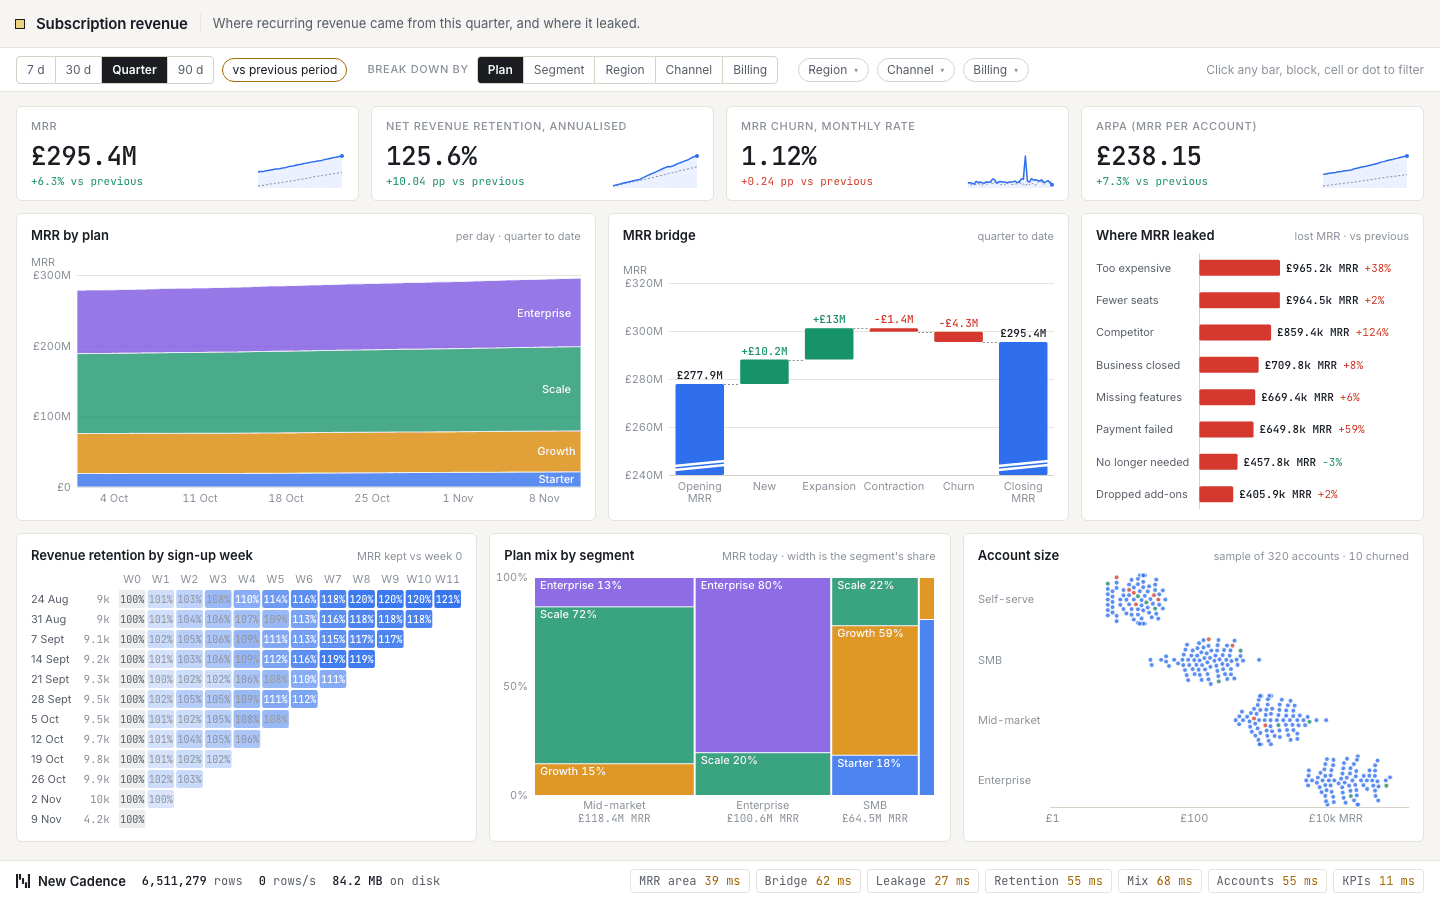
Where recurring revenue came from and where it leaked. A waterfall splits the change in monthly recurring revenue into new, expansion, contraction and churn, alongside revenue by plan, cohort retention and the spread of account sizes. Filter by plan, segment, region or acquisition channel and every chart follows. ClickHouse holds the latest state of each subscription and rebuilds cohorts on the fly.
 28
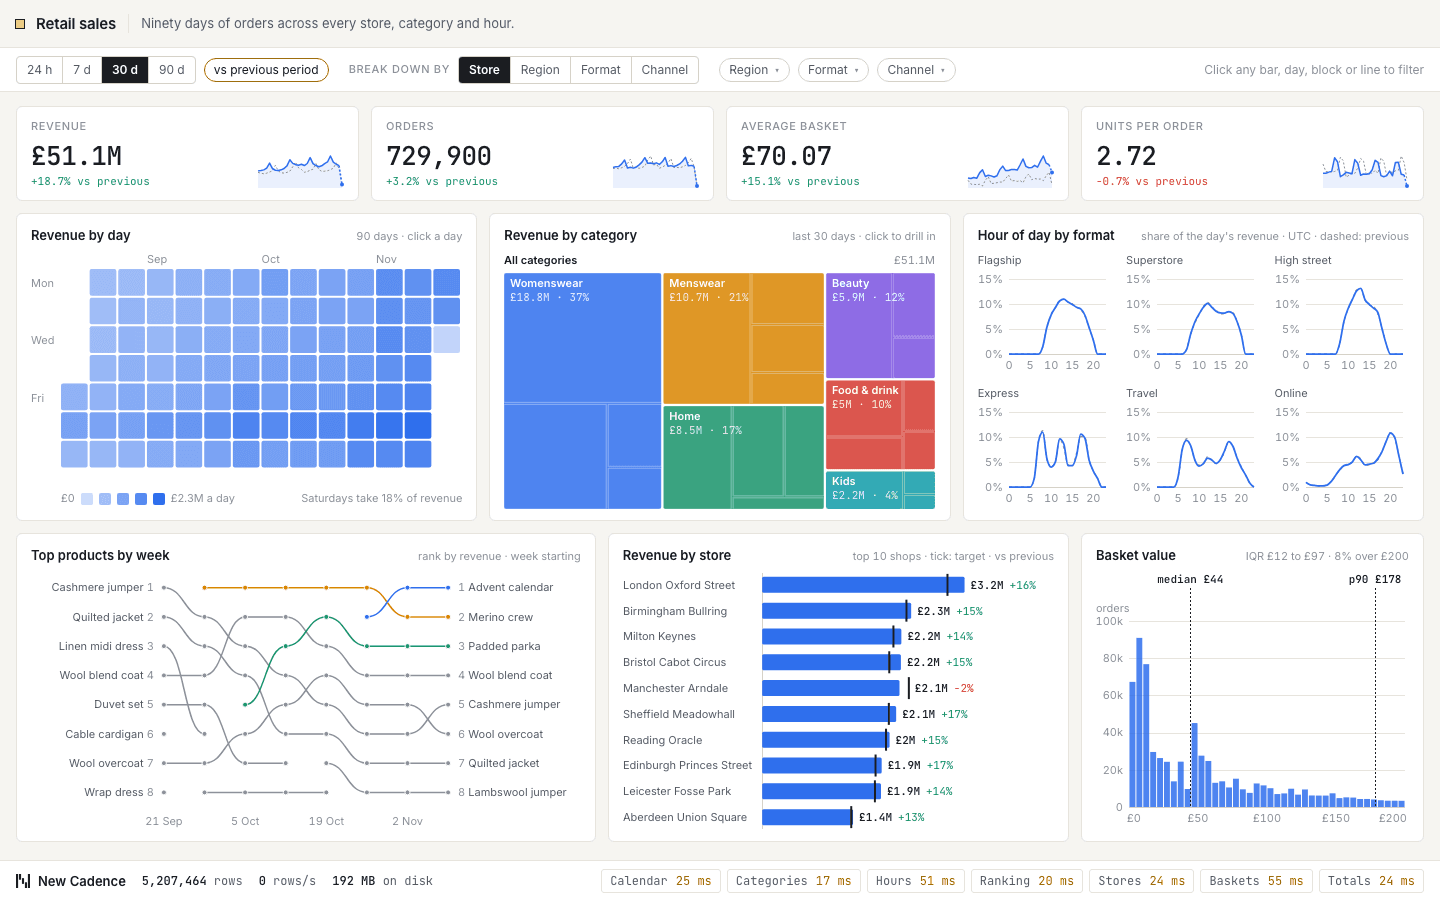
Ninety days of orders across every store, category and hour. A calendar shows revenue day by day, a treemap drills from category to product, and a ranking chart follows the best sellers week by week, next to basket sizes and store performance against target. Slice by region, store format, category or channel. ClickHouse serves the common cuts from summing rollups and the rarer ones from the raw orders.
 33
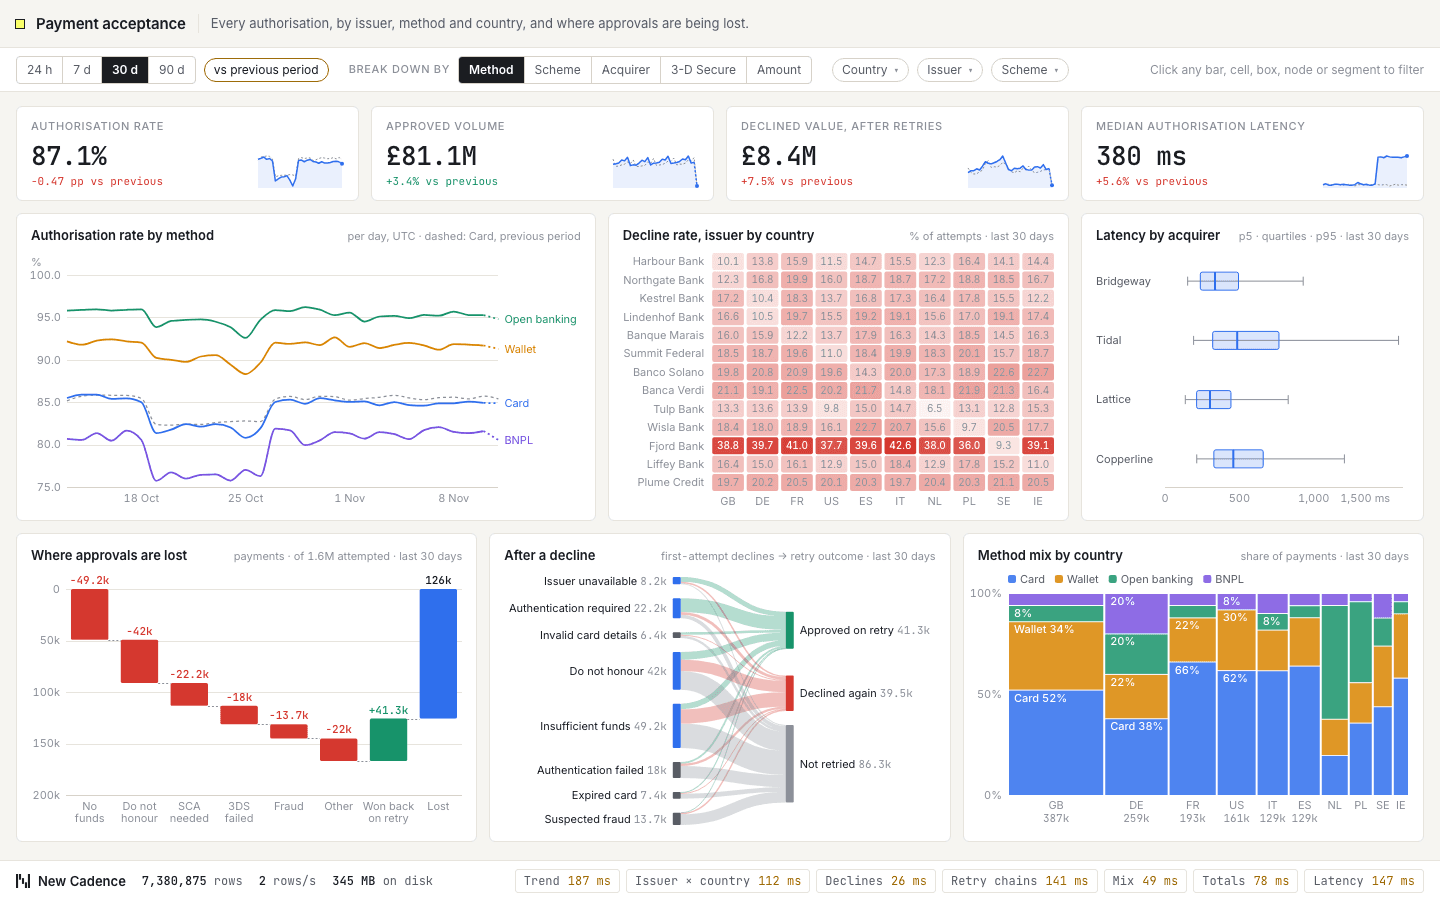
Every card authorisation by issuer, method and country, and where approvals are being lost. Approval rate over time, an issuer-by-country grid, a waterfall from attempted to approved by decline reason, what happens on retries, and latency by acquirer. Filter by country, method, scheme, issuer or amount. ClickHouse keeps approval ratios in rollups and follows retry chains through the raw authorisations.
 34
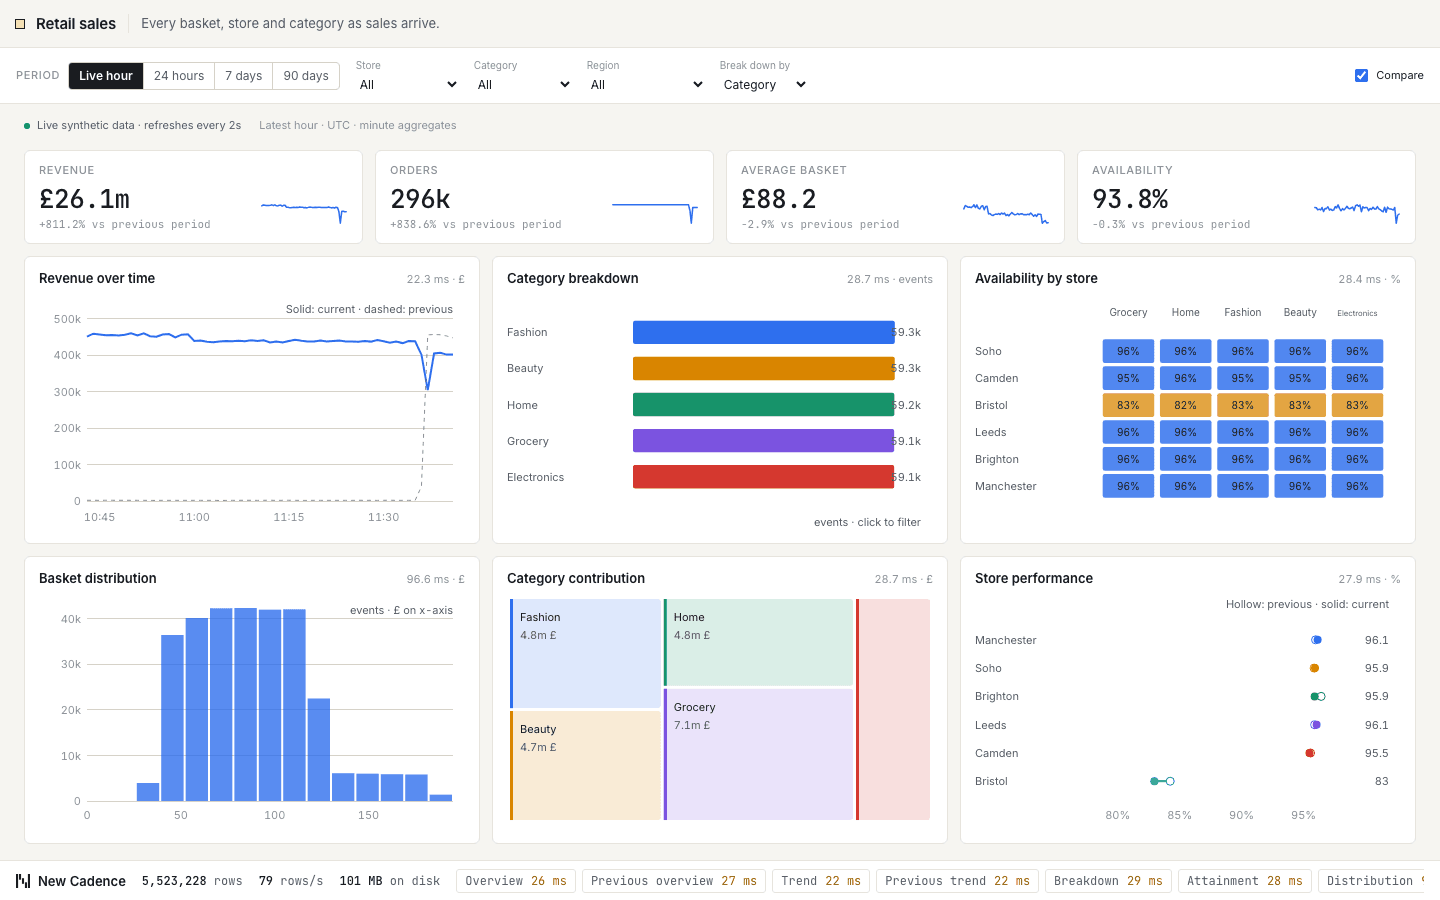
Every basket, store and category as sales arrive. Headline figures for revenue, orders, average basket and availability sit above six charts, including revenue over time, category contribution and availability by store. Filter by store or category, change the period, compare with the previous one, and every chart re-queries. ClickHouse answers each cut from minute-level rollups as new events stream in.
 35
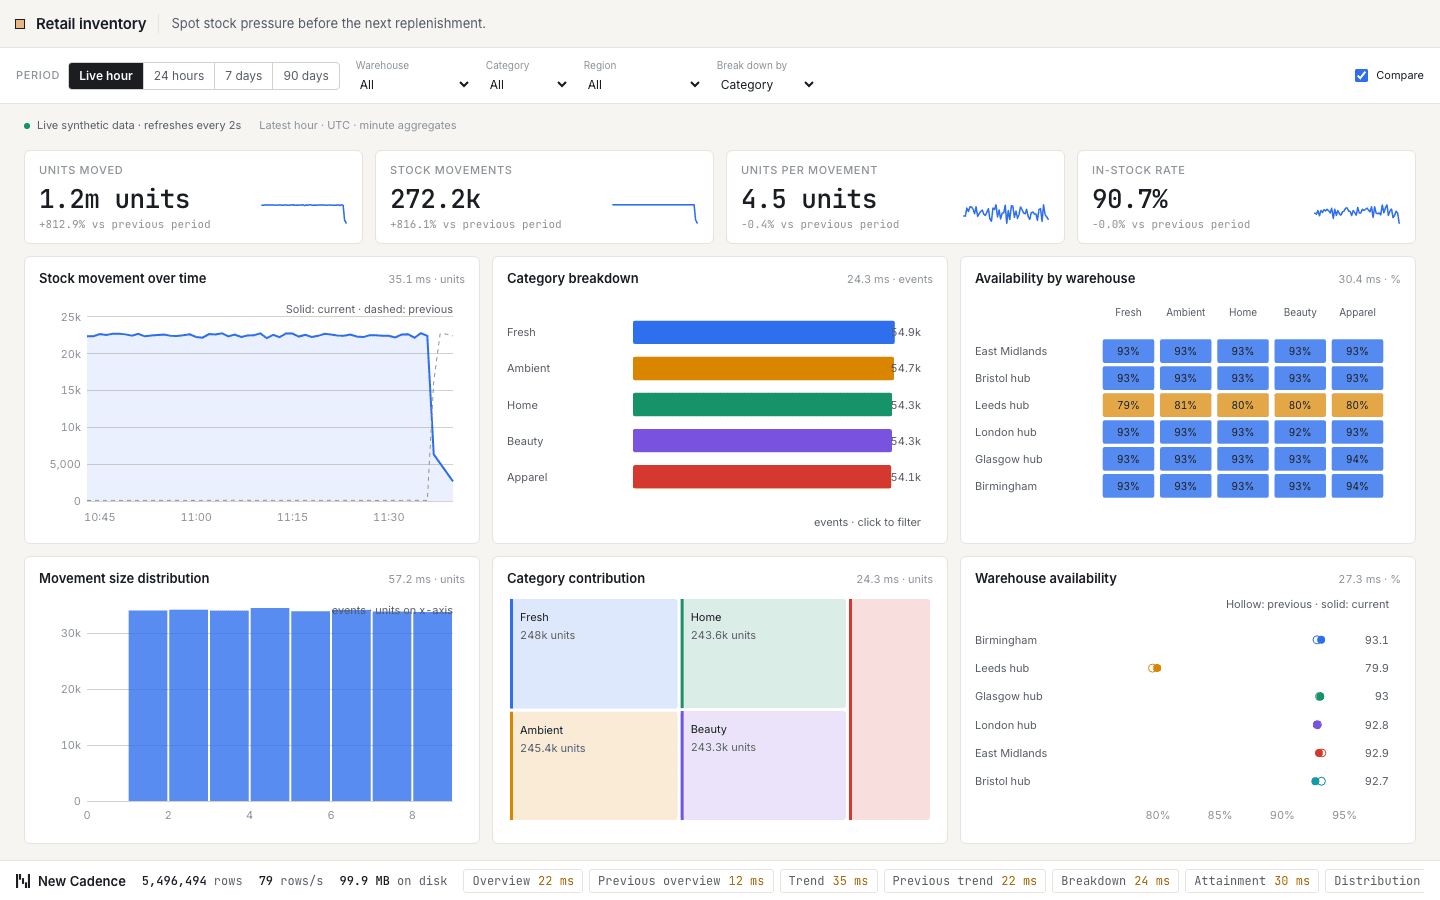
Spot stock pressure before the next replenishment. Headline figures for units moved, stock movements, units per movement and in-stock rate sit above six charts, including stock movement over time, units by category and availability by warehouse. Filter by warehouse or category, change the period, compare with the previous one, and every chart re-queries. ClickHouse answers each cut from minute-level rollups as new events stream in.
 36
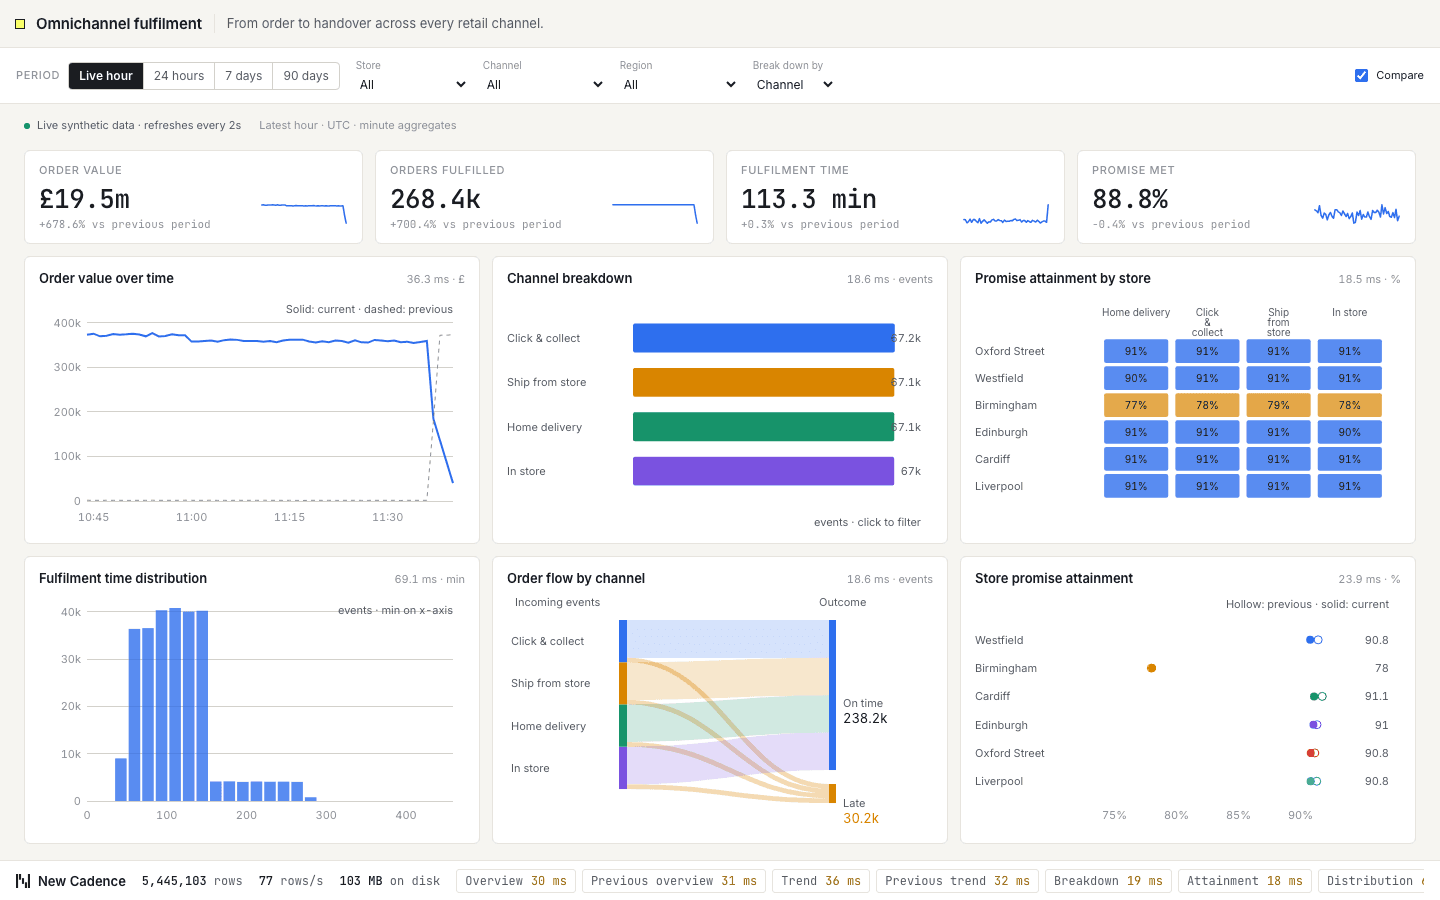
From order to handover across every retail channel. Headline figures for order value, orders fulfilled, fulfilment time and promise met sit above six charts, including order value over time, channel order mix and promise attainment by store. Filter by store or channel, change the period, compare with the previous one, and every chart re-queries. ClickHouse answers each cut from minute-level rollups as new events stream in.
Whether you're evaluating ClickHouse, planning a migration, or optimising an existing deployment get in touch now for an initial discussion.
Get in Touch